Research Summary
Optical spectrometers are analytical instruments designed to measure and analyze the spectrum of light, which includes its various wavelengths and intensities. They play a critical role in fields such as chemistry, physics, astronomy, and environmental science by providing insights into the composition, structure, and properties of materials. Optical spectrometers use components like prisms or diffraction gratings to disperse light into its constituent colors or wavelengths, which are then detected and quantified. This enables scientists and researchers to identify chemical compounds, study the energy levels of atoms and molecules, and conduct various types of spectroscopic analyses. Optical spectrometers are essential tools for both qualitative and quantitative analysis, aiding in a wide range of applications, from identifying elements in distant stars to analyzing the composition of compounds in laboratories.
According to WENKH research statistics, the global Optical Spectrometers market size will reach 9,586 Million USD in 2025 and is projected to reach 14,518 Million USD by 2032, with a CAGR of 6.11% (2025-2032). Among them, the Asia-Pacific Optical Spectrometers market is undergoing rapid changes, reaching Million USD in 2025, accounting for approximately % of the global market share. It is projected to reach Million USD by 2032.
The global optical spectrometer market is poised for significant growth, driven by expanding applications in environmental monitoring, biotechnology, semiconductor manufacturing, and food safety. As industries push for more precise material analysis and process control, demand for high-resolution, real-time spectroscopic instruments continues to rise. Governments worldwide are also increasing investments in air and water quality monitoring, further boosting public-sector procurement of portable and fixed spectrometers. In particular, the need for non-destructive testing and trace element detection is accelerating adoption across both research and industrial settings.
Asia-Pacific is expected to lead the next growth wave, fueled by rapid industrialization and innovation in countries like China, Japan, South Korea, and India. In China, policies supporting “Made in China 2025” and aggressive investment in environmental tech are creating robust demand for domestic spectrometer solutions. Universities, national labs, and private research institutes are expanding their equipment budgets to support advanced optical sensing applications, ranging from agricultural analysis to semiconductor inspection. Meanwhile, localized production and rising technical capabilities among regional manufacturers are making spectrometer systems more accessible and affordable to a broader user base.
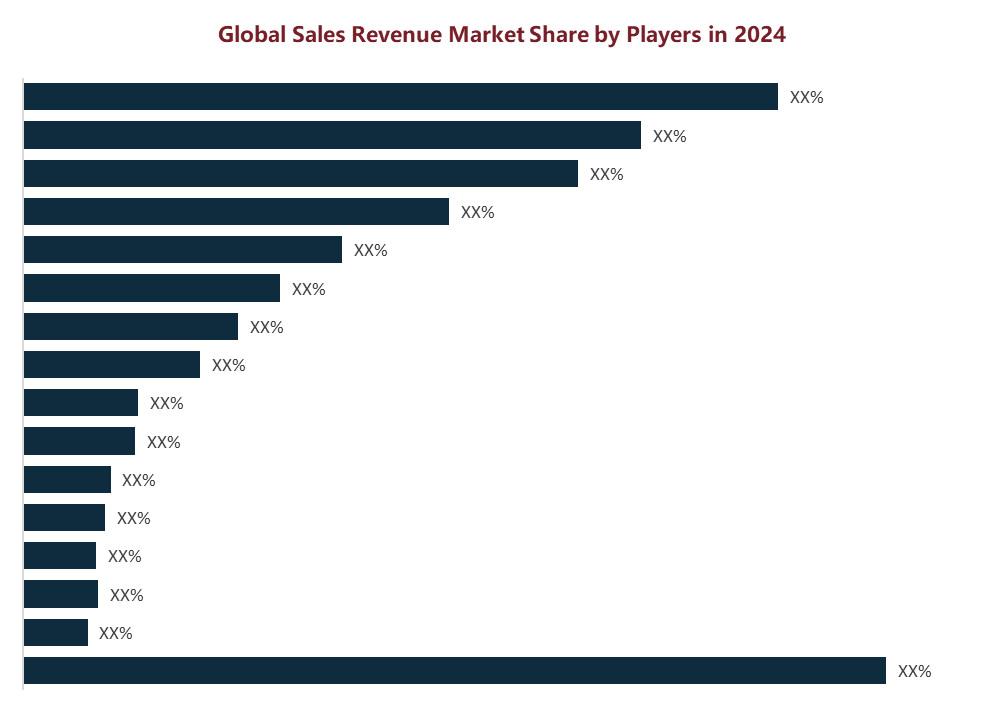
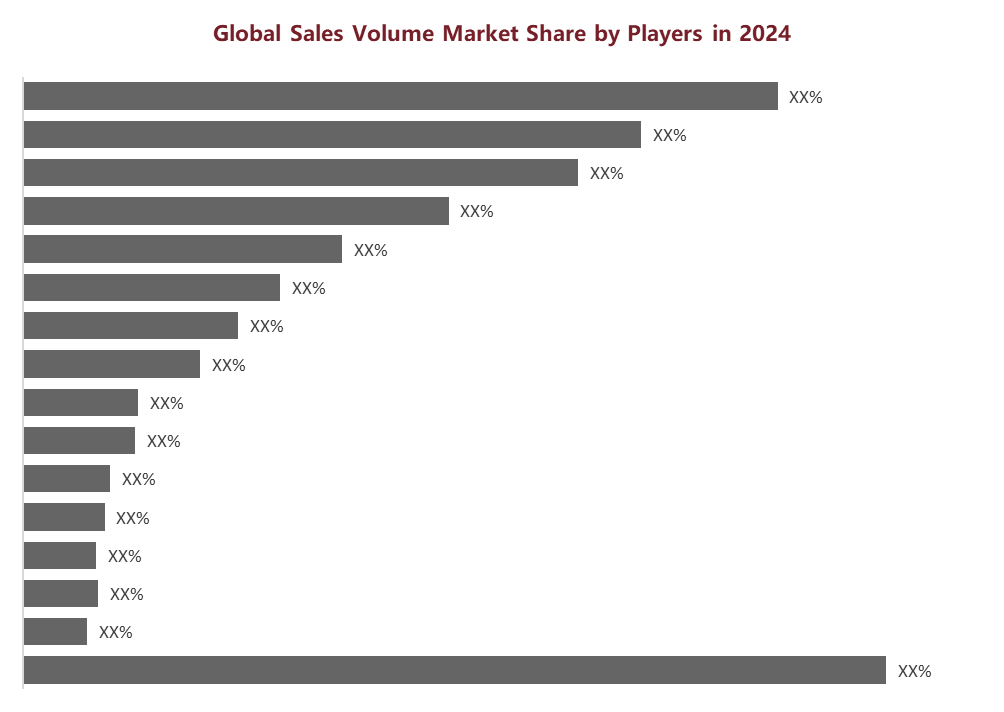
The global Optical Spectrometers market is highly competitive, with key market players including Thermo Scientific, Agilent Technologies, Shimadzu, PerkinElmer, Bruker, Olympus, Spectro, Horiba, Hitachi, Zolix, Skyray Instrument, Spectris, Hamamatsu Photonics, Ocean Optics, ABB, Ocean Insight, Viavi, Si-Ware Systems, Analytik Jena, B&W Tek, OTO Photonics, etc. This report categorizes the competitive landscape of the global Optical Spectrometers market into three tiers based on annual revenue, with the top three market players holding approximately % of the total market share.
This report provides an in-depth analysis of the global Optical Spectrometers market, including market size, price trends, market status and future development prospects. It particularly focuses on the market share, product characteristics, pricing, revenue, sales volume and gross profit margin of major manufacturers in the global Optical Spectrometers industry. Additionally, this report provides an in-depth analysis of the market status and future development trends of different segments of Optical Spectrometers and their downstream application fields.
In terms of data coverage, this report includes extensive time-series data. Historical data spans from 2020 to 2024, providing a solid foundation for analyzing market development trends. The year 2025 is used as a base year to accurately assess the current market landscape, while forecast data extends from 2026 to 2032, using scientific analysis methods and models to offer forward-looking projections and insights into the market's future trajectory. This provides valuable reference information for industry participants and stakeholders.
The report covers countries including United States, China, Germany, Japan, France, South Korea, United Kingdom, India, Italy, Brazil, Mexico, Indonesia, Vietnam and South Africa. It particularly focuses on the revenue and sales volume of Optical Spectrometers in these countries, as well as the product segmentation and downstream application market size of each country. The report provides an in-depth analysis of the regional distribution and future development trends of the Optical Spectrometers market. By considering local policies, this report evaluates the market prospects of Optical Spectrometers in each country, aiming to help companies gain a comprehensive understanding of the industry characteristics and development potential in different regions, optimize regional business layout, and develop precise market strategies to achieve global development goals.
This report places significant emphasis on data quality and reliability, leveraging a wide range of data sources to ensure accuracy and validity. Primary data collection is conducted through multiple channels, including in-depth interviews with senior corporate executives, industry experts, supply chain participants, and end consumers. This helps to gain insights into corporate strategic planning, industry policies, supply chain dynamics, and user experiences. Secondary data sources cover an extensive range, including authoritative government statistics, customs databases, industry related reports, third-party paid databases, investment research reports, academic studies, corporate financial statements, real-time media updates, and information from international organizations, all of which serve as a solid foundation for data verification and analysis.
Companies Covered
Thermo Scientific
Agilent Technologies
Shimadzu
PerkinElmer
Bruker
Olympus
Spectro
Horiba
Hitachi
Zolix
Skyray Instrument
Spectris
Hamamatsu Photonics
Ocean Optics
ABB
Ocean Insight
Viavi
Si-Ware Systems
Analytik Jena
B&W Tek
OTO Photonics
Product Segment
Atomic spectrometry
Molecular spectrometry
Product Application
Pharmaceuticals
Food & Beverage
Consumer Electronics
Agriculture
Medical
Academia & Teaching
Others
Chapter Scope
Chapter 1: Product Statistical Scope, Product Segmentation Types and Downstream Applications, Overall Market Size, Current Status and Development Prospects
Chapter 2: Global Optical Spectrometers Industry Chain Analysis
Chapter 3: Global Optical Spectrometers Industry Environment Analysis and Porter's Five Forces Analysis
Chapter 4: Analysis of the Competitive Landscape of Major Companies in the Global Optical Spectrometers Market (Market Share, Product Revenue and Sales Volume Comparison, Tier Division, Corporate Expansion and M&A Trends)
Chapter 5: Analysis of Global Major Companies (Company Profiles, Product Specifications and Features, Product Revenue, Product Sales Volume, Product Average Price and Product Gross Profit Margin)
Chapter 6: Global Optical Spectrometers Market Analysis by Countries, Product Segment and Downstream Application (Sales Volume, Revenue and Average Price)
Chapter 7: United States Optical Spectrometers Market Size, Product Segment, Downstream Application Analysis (Sales Volume, Revenue and Average Price)
Chapter 8: China Optical Spectrometers Market Size, Product Segment, Downstream Application Analysis (Sales Volume, Revenue and Average Price)
Chapter 9: Germany Optical Spectrometers Market Size, Product Segment, Downstream Application Analysis (Sales Volume, Revenue and Average Price)
Chapter 10: Japan Optical Spectrometers Market Size, Product Segment, Downstream Application Analysis (Sales Volume, Revenue and Average Price)
Chapter 11: France Optical Spectrometers Market Size, Product Segment, Downstream Application Analysis (Sales Volume, Revenue and Average Price)
Chapter 12: South Korea Optical Spectrometers Market Size, Product Segment, Downstream Application Analysis (Sales Volume, Revenue and Average Price)
Chapter 13: United Kingdom Optical Spectrometers Market Size, Product Segment, Downstream Application Analysis (Sales Volume, Revenue and Average Price)
Chapter 14: India Optical Spectrometers Market Size, Product Segment, Downstream Application Analysis (Sales Volume, Revenue and Average Price)
Chapter 15: Italy Optical Spectrometers Market Size, Product Segment, Downstream Application Analysis (Sales Volume, Revenue and Average Price)
Chapter 16: Brazil Optical Spectrometers Market Size, Product Segment, Downstream Application Analysis (Sales Volume, Revenue and Average Price)
Chapter 17: Mexico Optical Spectrometers Market Size, Product Segment, Downstream Application Analysis (Sales Volume, Revenue and Average Price)
Chapter 18: Indonesia Optical Spectrometers Market Size, Product Segment, Downstream Application Analysis (Sales Volume, Revenue and Average Price)
Chapter 19: Vietnam Optical Spectrometers Market Size, Product Segment, Downstream Application Analysis (Sales Volume, Revenue and Average Price)
Chapter 20: South Africa Optical Spectrometers Market Size, Product Segment, Downstream Application Analysis (Sales Volume, Revenue and Average Price)
Chapter 21: Research Conclusion
Chapter 22: Methodology and Data Source
Purpose and Value of the Report
Market Trend Insights: Analyze industry trends, market dynamics, and future growth potential to help companies forecast changes and develop strategic plans.
Competitive Landscape Analysis: Understand key players' revenue segmentation, strategies, market share, and business models to guide competitive decisions.
Investment Decision Support: Provide feasibility analysis through market size, growth rate, demand trends, and potential risks for informed investment decisions.
Target Customer and Demand Analysis: Examine consumer behavior, purchasing preferences, and pain points to optimize products and improve market penetration.
Policy and Regulatory Insights: Interpret relevant industry policies to ensure compliance and mitigate regulatory risks.
Business Model Optimization: Offer data-driven suggestions for enhancing business models and improving profitability.
Table of Content
1 Optical Spectrometers Market Overview
1.1 Product Definition Introduction
1.2 Global Optical Spectrometers Market Size and Growth Forecast Analysis (2020-2032)
1.3 Optical Spectrometers Market Status and Development Prospects
1.3.1 Optical Spectrometers Market Status
1.3.2 Optical Spectrometers Industry Development Prospects
1.4 Optical Spectrometers Market Overview by Product Segment
1.4.1 Global Optical Spectrometers Market Size and Growth Forecast Analysis by Product Segment: 2020 VS 2025 VS 2032
1.4.2 Atomic spectrometry
1.4.3 Molecular spectrometry
1.5 Optical Spectrometers Market Overview by Product Application
1.5.1 Global Optical Spectrometers Market Size and Growth Forecast Analysis by Product Application: 2020 VS 2025 VS 2032
1.5.2 Pharmaceuticals
1.5.3 Food & Beverage
1.5.4 Consumer Electronics
1.5.5 Agriculture
1.5.6 Medical
1.5.7 Academia & Teaching
1.5.8 Others
2 Optical Spectrometers Industry Supply Chain Analysis
2.1 Optical Spectrometers Supply Chain
2.2 Optical Spectrometers Industry Upstream Supply Analysis
2.2.1 Upstream Raw Materials Supply Status
2.2.2 Key Raw Material Suppliers
2.3 Optical Spectrometers Midstream Manufacturers
2.4 Optical Spectrometers Downstream Customers
2.5 Optical Spectrometers Sales Channel Analysis
3 Optical Spectrometers Market Environment Analysis
3.1 Optical Spectrometers Industry Policy Analysis
3.2 Optical Spectrometers Emerging Technology Trends in the Industry
3.3 Optical Spectrometers Restraining Factors Analysis
3.4 Optical Spectrometers Market Porter's Five Forces Analysis
3.4.1 Competitive Rivalry
3.4.2 Threat of New Entrants
3.4.3 Bargaining Power of Suppliers
3.4.4 Bargaining Power of Buyers
3.4.5 Threat of Substitute Products or Services
4 Global Optical Spectrometers Manufacturer Competition Landscape
4.1 Global Optical Spectrometers Market Sales Volume, Revenue by Key Manufacturers (2021-2025)
4.1.1 Global Optical Spectrometers Market Sales Volume by Key Manufacturers (2021-2025)
4.1.2 Global Optical Spectrometers Market Revenue by Key Manufacturers (2021-2025)
4.2 Global Optical Spectrometers Market Position by Key Manufacturers
4.3 China Optical Spectrometers Market Position by Key Manufacturers
4.4 Global Key Manufacturers Headquarter and Key Area Served
4.5 Global Optical Spectrometers Market Expansion and M&A Dynamic
5 In-depth Analysis of Key Players
5.1 Thermo Scientific
5.1.1 Thermo Scientific Basic Information (Total Revenue, Employees, Main Business, Service Area and Contact Information)
5.1.2 Thermo Scientific Optical Spectrometers Product Features
5.1.3 Thermo Scientific Optical Spectrometers Product Revenue, Sales Volume, Price and Gross Margin Analysis (2021-2025)
5.2 Agilent Technologies
5.2.1 Agilent Technologies Basic Information (Total Revenue, Employees, Main Business, Service Area and Contact Information)
5.2.2 Agilent Technologies Optical Spectrometers Product Features
5.2.3 Agilent Technologies Optical Spectrometers Product Revenue, Sales Volume, Price and Gross Margin Analysis (2021-2025)
5.3 Shimadzu
5.3.1 Shimadzu Basic Information (Total Revenue, Employees, Main Business, Service Area and Contact Information)
5.3.2 Shimadzu Optical Spectrometers Product Features
5.3.3 Shimadzu Optical Spectrometers Product Revenue, Sales Volume, Price and Gross Margin Analysis (2021-2025)
5.4 PerkinElmer
5.4.1 PerkinElmer Basic Information (Total Revenue, Employees, Main Business, Service Area and Contact Information)
5.4.2 PerkinElmer Optical Spectrometers Product Features
5.4.3 PerkinElmer Optical Spectrometers Product Revenue, Sales Volume, Price and Gross Margin Analysis (2021-2025)
5.5 Bruker
5.5.1 Bruker Basic Information (Total Revenue, Employees, Main Business, Service Area and Contact Information)
5.5.2 Bruker Optical Spectrometers Product Features
5.5.3 Bruker Optical Spectrometers Product Revenue, Sales Volume, Price and Gross Margin Analysis (2021-2025)
5.6 Olympus
5.6.1 Olympus Basic Information (Total Revenue, Employees, Main Business, Service Area and Contact Information)
5.6.2 Olympus Optical Spectrometers Product Features
5.6.3 Olympus Optical Spectrometers Product Revenue, Sales Volume, Price and Gross Margin Analysis (2021-2025)
5.7 Spectro
5.7.1 Spectro Basic Information (Total Revenue, Employees, Main Business, Service Area and Contact Information)
5.7.2 Spectro Optical Spectrometers Product Features
5.7.3 Spectro Optical Spectrometers Product Revenue, Sales Volume, Price and Gross Margin Analysis (2021-2025)
5.8 Horiba
5.8.1 Horiba Basic Information (Total Revenue, Employees, Main Business, Service Area and Contact Information)
5.8.2 Horiba Optical Spectrometers Product Features
5.8.3 Horiba Optical Spectrometers Product Revenue, Sales Volume, Price and Gross Margin Analysis (2021-2025)
5.9 Hitachi
5.9.1 Hitachi Basic Information (Total Revenue, Employees, Main Business, Service Area and Contact Information)
5.9.2 Hitachi Optical Spectrometers Product Features
5.9.3 Hitachi Optical Spectrometers Product Revenue, Sales Volume, Price and Gross Margin Analysis (2021-2025)
5.10 Zolix
5.10.1 Zolix Basic Information (Total Revenue, Employees, Main Business, Service Area and Contact Information)
5.10.2 Zolix Optical Spectrometers Product Features
5.10.3 Zolix Optical Spectrometers Product Revenue, Sales Volume, Price and Gross Margin Analysis (2021-2025)
5.11 Skyray Instrument
5.11.1 Skyray Instrument Basic Information (Total Revenue, Employees, Main Business, Service Area and Contact Information)
5.11.2 Skyray Instrument Optical Spectrometers Product Features
5.11.3 Skyray Instrument Optical Spectrometers Product Revenue, Sales Volume, Price and Gross Margin Analysis (2021-2025)
5.12 Spectris
5.12.1 Spectris Basic Information (Total Revenue, Employees, Main Business, Service Area and Contact Information)
5.12.2 Spectris Optical Spectrometers Product Features
5.12.3 Spectris Optical Spectrometers Product Revenue, Sales Volume, Price and Gross Margin Analysis (2021-2025)
5.13 Hamamatsu Photonics
5.13.1 Hamamatsu Photonics Basic Information (Total Revenue, Employees, Main Business, Service Area and Contact Information)
5.13.2 Hamamatsu Photonics Optical Spectrometers Product Features
5.13.3 Hamamatsu Photonics Optical Spectrometers Product Revenue, Sales Volume, Price and Gross Margin Analysis (2021-2025)
5.14 Ocean Optics
5.14.1 Ocean Optics Basic Information (Total Revenue, Employees, Main Business, Service Area and Contact Information)
5.14.2 Ocean Optics Optical Spectrometers Product Features
5.14.3 Ocean Optics Optical Spectrometers Product Revenue, Sales Volume, Price and Gross Margin Analysis (2021-2025)
5.15 ABB
5.15.1 ABB Basic Information (Total Revenue, Employees, Main Business, Service Area and Contact Information)
5.15.2 ABB Optical Spectrometers Product Features
5.15.3 ABB Optical Spectrometers Product Revenue, Sales Volume, Price and Gross Margin Analysis (2021-2025)
5.16 Ocean Insight
5.16.1 Ocean Insight Basic Information (Total Revenue, Employees, Main Business, Service Area and Contact Information)
5.16.2 Ocean Insight Optical Spectrometers Product Features
5.16.3 Ocean Insight Optical Spectrometers Product Revenue, Sales Volume, Price and Gross Margin Analysis (2021-2025)
5.17 Viavi
5.17.1 Viavi Basic Information (Total Revenue, Employees, Main Business, Service Area and Contact Information)
5.17.2 Viavi Optical Spectrometers Product Features
5.17.3 Viavi Optical Spectrometers Product Revenue, Sales Volume, Price and Gross Margin Analysis (2021-2025)
5.18 Si-Ware Systems
5.18.1 Si-Ware Systems Basic Information (Total Revenue, Employees, Main Business, Service Area and Contact Information)
5.18.2 Si-Ware Systems Optical Spectrometers Product Features
5.18.3 Si-Ware Systems Optical Spectrometers Product Revenue, Sales Volume, Price and Gross Margin Analysis (2021-2025)
5.19 Analytik Jena
5.19.1 Analytik Jena Basic Information (Total Revenue, Employees, Main Business, Service Area and Contact Information)
5.19.2 Analytik Jena Optical Spectrometers Product Features
5.19.3 Analytik Jena Optical Spectrometers Product Revenue, Sales Volume, Price and Gross Margin Analysis (2021-2025)
5.20 B&W Tek
5.20.1 B&W Tek Basic Information (Total Revenue, Employees, Main Business, Service Area and Contact Information)
5.20.2 B&W Tek Optical Spectrometers Product Features
5.20.3 B&W Tek Optical Spectrometers Product Revenue, Sales Volume, Price and Gross Margin Analysis (2021-2025)
5.21 OTO Photonics
5.21.1 OTO Photonics Basic Information (Total Revenue, Employees, Main Business, Service Area and Contact Information)
5.21.2 OTO Photonics Optical Spectrometers Product Features
5.21.3 OTO Photonics Optical Spectrometers Product Revenue, Sales Volume, Price and Gross Margin Analysis (2021-2025)
6 Global Optical Spectrometers Market Analysis by Countries, by Product Segment and Application
6.1 Global Optical Spectrometers Market Size and Growth Forecast by Countries: 2020 VS 2025 VS 2032
6.1.1 Global Optical Spectrometers Market Revenue by Countries (2020-2025)
6.1.2 Global Optical Spectrometers Market Revenue Forecast by Countries (2026-2032)
6.2 Global Optical Spectrometers Market Sales Volume Analysis
6.2.1 Global Optical Spectrometers Market Sales Volume by Countries (2020-2025)
6.2.2 Global Optical Spectrometers Market Sales Volume Forecast by Countries (2026-2032)
6.3 Global Optical Spectrometers Market by Product Segment (2020-2032)
6.3.1 Global Optical Spectrometers Market Revenue and Forecast by Product Segment
6.3.2 Global Optical Spectrometers Market Sales Volume and Forecast by Product Segment
6.4 Global Optical Spectrometers Market by Product Application (2020-2032)
6.4.1 Global Optical Spectrometers Market Revenue and Forecast by Product Application
6.4.2 Global Optical Spectrometers Market Sales Volume and Forecast by Product Application
7 United States Optical Spectrometers Market Analysis
7.1 United States Optical Spectrometers Market Prospects
7.1.1 United States Optical Spectrometers Revenue and Growth Forecast (2020-2032)
7.1.2 United States Optical Spectrometers Market Sales Volume and Growth Forecast (2020-2032)
7.2 United States Optical Spectrometers Market by Product Segment (2020-2032)
7.2.1 United States Optical Spectrometers Market Revenue and Forecast Analysis by Product Segment
7.2.2 United States Optical Spectrometers Market Sales Volume and Forecast Analysis by Product Segment
7.3 United States Optical Spectrometers Market by Product Application (2020-2032)
7.3.1 United States Optical Spectrometers Market Revenue and Forecast Analysis by Product Application
7.3.2 United States Optical Spectrometers Market Sales Volume and Forecast Analysis by Product Application
8 China Optical Spectrometers Market Analysis
8.1 China Optical Spectrometers Market Prospects
8.1.1 China Optical Spectrometers Revenue and Growth Forecast (2020-2032)
8.1.2 China Optical Spectrometers Market Sales Volume and Growth Forecast (2020-2032)
8.2 China Optical Spectrometers Market by Product Segment (2020-2032)
8.2.1 China Optical Spectrometers Market Revenue and Forecast Analysis by Product Segment
8.2.2 China Optical Spectrometers Market Sales Volume and Forecast Analysis by Product Segment
8.3 China Optical Spectrometers Market by Product Application (2020-2032)
8.3.1 China Optical Spectrometers Market Revenue and Forecast Analysis by Product Application
8.3.2 China Optical Spectrometers Market Sales Volume and Forecast Analysis by Product Application
9 Germany Optical Spectrometers Market Analysis
9.1 Germany Optical Spectrometers Market Prospects
9.1.1 Germany Optical Spectrometers Revenue and Growth Forecast (2020-2032)
9.1.2 Germany Optical Spectrometers Market Sales Volume and Growth Forecast (2020-2032)
9.2 Germany Optical Spectrometers Market by Product Segment (2020-2032)
9.2.1 Germany Optical Spectrometers Market Revenue and Forecast Analysis by Product Segment
9.2.2 Germany Optical Spectrometers Market Sales Volume and Forecast Analysis by Product Segment
9.3 Germany Optical Spectrometers Market by Product Application (2020-2032)
9.3.1 Germany Optical Spectrometers Market Revenue and Forecast Analysis by Product Application
9.3.2 Germany Optical Spectrometers Market Sales Volume and Forecast Analysis by Product Application
10 Japan Optical Spectrometers Market Analysis
10.1 Japan Optical Spectrometers Market Prospects
10.1.1 Japan Optical Spectrometers Revenue and Growth Forecast (2020-2032)
10.1.2 Japan Optical Spectrometers Market Sales Volume and Growth Forecast (2020-2032)
10.2 Japan Optical Spectrometers Market by Product Segment (2020-2032)
10.2.1 Japan Optical Spectrometers Market Revenue and Forecast Analysis by Product Segment
10.2.2 Japan Optical Spectrometers Market Sales Volume and Forecast Analysis by Product Segment
10.3 Japan Optical Spectrometers Market by Product Application (2020-2032)
10.3.1 Japan Optical Spectrometers Market Revenue and Forecast Analysis by Product Application
10.3.2 Japan Optical Spectrometers Market Sales Volume and Forecast Analysis by Product Application
11 France Optical Spectrometers Market Analysis
11.1 France Optical Spectrometers Market Prospects
11.1.1 France Optical Spectrometers Revenue and Growth Forecast (2020-2032)
11.1.2 France Optical Spectrometers Market Sales Volume and Growth Forecast (2020-2032)
11.2 France Optical Spectrometers Market by Product Segment (2020-2032)
11.2.1 France Optical Spectrometers Market Revenue and Forecast Analysis by Product Segment
11.2.2 France Optical Spectrometers Market Sales Volume and Forecast Analysis by Product Segment
11.3 France Optical Spectrometers Market by Product Application (2020-2032)
11.3.1 France Optical Spectrometers Market Revenue and Forecast Analysis by Product Application
11.3.2 France Optical Spectrometers Market Sales Volume and Forecast Analysis by Product Application
12 South Korea Optical Spectrometers Market Analysis
12.1 South Korea Optical Spectrometers Market Prospects
12.1.1 South Korea Optical Spectrometers Revenue and Growth Forecast (2020-2032)
12.1.2 South Korea Optical Spectrometers Market Sales Volume and Growth Forecast (2020-2032)
12.2 South Korea Optical Spectrometers Market by Product Segment (2020-2032)
12.2.1 South Korea Optical Spectrometers Market Revenue and Forecast Analysis by Product Segment
12.2.2 South Korea Optical Spectrometers Market Sales Volume and Forecast Analysis by Product Segment
12.3 South Korea Optical Spectrometers Market by Product Application (2020-2032)
12.3.1 South Korea Optical Spectrometers Market Revenue and Forecast Analysis by Product Application
12.3.2 South Korea Optical Spectrometers Market Sales Volume and Forecast Analysis by Product Application
13 United Kingdom Optical Spectrometers Market Analysis
13.1 United Kingdom Optical Spectrometers Market Prospects
13.1.1 United Kingdom Optical Spectrometers Revenue and Growth Forecast (2020-2032)
13.1.2 United Kingdom Optical Spectrometers Market Sales Volume and Growth Forecast (2020-2032)
13.2 United Kingdom Optical Spectrometers Market by Product Segment (2020-2032)
13.2.1 United Kingdom Optical Spectrometers Market Revenue and Forecast Analysis by Product Segment
13.2.2 United Kingdom Optical Spectrometers Market Sales Volume and Forecast Analysis by Product Segment
13.3 United Kingdom Optical Spectrometers Market by Product Application (2020-2032)
13.3.1 United Kingdom Optical Spectrometers Market Revenue and Forecast Analysis by Product Application
13.3.2 United Kingdom Optical Spectrometers Market Sales Volume and Forecast Analysis by Product Application
14 India Optical Spectrometers Market Analysis
14.1 India Optical Spectrometers Market Prospects
14.1.1 India Optical Spectrometers Revenue and Growth Forecast (2020-2032)
14.1.2 India Optical Spectrometers Market Sales Volume and Growth Forecast (2020-2032)
14.2 India Optical Spectrometers Market by Product Segment (2020-2032)
14.2.1 India Optical Spectrometers Market Revenue and Forecast Analysis by Product Segment
14.2.2 India Optical Spectrometers Market Sales Volume and Forecast Analysis by Product Segment
14.3 India Optical Spectrometers Market by Product Application (2020-2032)
14.3.1 India Optical Spectrometers Market Revenue and Forecast Analysis by Product Application
14.3.2 India Optical Spectrometers Market Sales Volume and Forecast Analysis by Product Application
15 Italy Optical Spectrometers Market Analysis
15.1 Italy Optical Spectrometers Market Prospects
15.1.1 Italy Optical Spectrometers Revenue and Growth Forecast (2020-2032)
15.1.2 Italy Optical Spectrometers Market Sales Volume and Growth Forecast (2020-2032)
15.2 Italy Optical Spectrometers Market by Product Segment (2020-2032)
15.2.1 Italy Optical Spectrometers Market Revenue and Forecast Analysis by Product Segment
15.2.2 Italy Optical Spectrometers Market Sales Volume and Forecast Analysis by Product Segment
15.3 Italy Optical Spectrometers Market by Product Application (2020-2032)
15.3.1 Italy Optical Spectrometers Market Revenue and Forecast Analysis by Product Application
15.3.2 Italy Optical Spectrometers Market Sales Volume and Forecast Analysis by Product Application
16 Brazil Optical Spectrometers Market Analysis
16.1 Brazil Optical Spectrometers Market Prospects
16.1.1 Brazil Optical Spectrometers Revenue and Growth Forecast (2020-2032)
16.1.2 Brazil Optical Spectrometers Market Sales Volume and Growth Forecast (2020-2032)
16.2 Brazil Optical Spectrometers Market by Product Segment (2020-2032)
16.2.1 Brazil Optical Spectrometers Market Revenue and Forecast Analysis by Product Segment
16.2.2 Brazil Optical Spectrometers Market Sales Volume and Forecast Analysis by Product Segment
16.3 Brazil Optical Spectrometers Market by Product Application (2020-2032)
16.3.1 Brazil Optical Spectrometers Market Revenue and Forecast Analysis by Product Application
16.3.2 Brazil Optical Spectrometers Market Sales Volume and Forecast Analysis by Product Application
17 Mexico Optical Spectrometers Market Analysis
17.1 Mexico Optical Spectrometers Market Prospects
17.1.1 Mexico Optical Spectrometers Revenue and Growth Forecast (2020-2032)
17.1.2 Mexico Optical Spectrometers Market Sales Volume and Growth Forecast (2020-2032)
17.2 Mexico Optical Spectrometers Market by Product Segment (2020-2032)
17.2.1 Mexico Optical Spectrometers Market Revenue and Forecast Analysis by Product Segment
17.2.2 Mexico Optical Spectrometers Market Sales Volume and Forecast Analysis by Product Segment
17.3 Mexico Optical Spectrometers Market by Product Application (2020-2032)
17.3.1 Mexico Optical Spectrometers Market Revenue and Forecast Analysis by Product Application
17.3.2 Mexico Optical Spectrometers Market Sales Volume and Forecast Analysis by Product Application
18 Indonesia Optical Spectrometers Market Analysis
18.1 Indonesia Optical Spectrometers Market Prospects
18.1.1 Indonesia Optical Spectrometers Revenue and Growth Forecast (2020-2032)
18.1.2 Indonesia Optical Spectrometers Market Sales Volume and Growth Forecast (2020-2032)
18.2 Indonesia Optical Spectrometers Market by Product Segment (2020-2032)
18.2.1 Indonesia Optical Spectrometers Market Revenue and Forecast Analysis by Product Segment
18.2.2 Indonesia Optical Spectrometers Market Sales Volume and Forecast Analysis by Product Segment
18.3 Indonesia Optical Spectrometers Market by Product Application (2020-2032)
18.3.1 Indonesia Optical Spectrometers Market Revenue and Forecast Analysis by Product Application
18.3.2 Indonesia Optical Spectrometers Market Sales Volume and Forecast Analysis by Product Application
19 Vietnam Optical Spectrometers Market Analysis
19.1 Vietnam Optical Spectrometers Market Prospects
19.1.1 Vietnam Optical Spectrometers Revenue and Growth Forecast (2020-2032)
19.1.2 Vietnam Optical Spectrometers Market Sales Volume and Growth Forecast (2020-2032)
19.2 Vietnam Optical Spectrometers Market by Product Segment (2020-2032)
19.2.1 Vietnam Optical Spectrometers Market Revenue and Forecast Analysis by Product Segment
19.2.2 Vietnam Optical Spectrometers Market Sales Volume and Forecast Analysis by Product Segment
19.3 Vietnam Optical Spectrometers Market by Product Application (2020-2032)
19.3.1 Vietnam Optical Spectrometers Market Revenue and Forecast Analysis by Product Application
19.3.2 Vietnam Optical Spectrometers Market Sales Volume and Forecast Analysis by Product Application
20 South Africa Optical Spectrometers Market Analysis
20.1 South Africa Optical Spectrometers Market Prospects
20.1.1 South Africa Optical Spectrometers Revenue and Growth Forecast (2020-2032)
20.1.2 South Africa Optical Spectrometers Market Sales Volume and Growth Forecast (2020-2032)
20.2 South Africa Optical Spectrometers Market by Product Segment (2020-2032)
20.2.1 South Africa Optical Spectrometers Market Revenue and Forecast Analysis by Product Segment
20.2.2 South Africa Optical Spectrometers Market Sales Volume and Forecast Analysis by Product Segment
20.3 South Africa Optical Spectrometers Market by Product Application (2020-2032)
20.3.1 South Africa Optical Spectrometers Market Revenue and Forecast Analysis by Product Application
20.3.2 South Africa Optical Spectrometers Market Sales Volume and Forecast Analysis by Product Application
21 Research Conclusion
22 Appendix
22.1 Methodology/Research Approach
22.2 Research Landscape
22.3 Research Benchmark and Hypothesis
22.4 Data Source
22.4.1 Primary Sources
22.4.2 Secondary Sources
22.5 Data Cross Validation
22.6 Disclaimer

Table 1:Global Optical Spectrometers Market Size and Growth Forecast Analysis by Product Segment (2020 VS 2025 VS 2032) & (Million USD)
Table 2:Global Optical Spectrometers Market Size and Growth Forecast Analysis by Product Application (2020 VS 2025 VS 2032) & (Million USD)
Table 3:Key Raw Materials and Market Concentration
Table 4:Optical Spectrometers Raw Material Suppliers and Contact Information
Table 5:Optical Spectrometers Downstream Customers List
Table 6:Optical Spectrometers Distributors/Dealers List
Table 7:Global Optical Spectrometers Market Sales Volume by Key Manufacturers (2021-2025) & (Units)
Table 8:Global Optical Spectrometers Market Revenue by Key Manufacturers (2021-2025) & (Million USD)
Table 9:Global Optical Spectrometers Market Position by Key Manufacturers
Table 10:China Optical Spectrometers Market Position by Key Manufacturers
Table 11:Global Key Manufacturers Headquarter and Key Area Served
Table 12:Global Optical Spectrometers Market Expansion and M&A Dynamic
Table 13:Thermo Scientific Basic Information (Total Revenue, Employees, Main Business, Service Area and Contact Information)
Table 14:Thermo Scientific Optical Spectrometers Product Features
Table 15:Thermo Scientific Optical Spectrometers Product Revenue (Million USD), Sales Volume (Units), Price (USD/Unit) and Gross Margin (2021-2025)
Table 16:Agilent Technologies Basic Information (Total Revenue, Employees, Main Business, Service Area and Contact Information)
Table 17:Agilent Technologies Optical Spectrometers Product Features
Table 18:Agilent Technologies Optical Spectrometers Product Revenue (Million USD), Sales Volume (Units), Price (USD/Unit) and Gross Margin (2021-2025)
Table 19:Shimadzu Basic Information (Total Revenue, Employees, Main Business, Service Area and Contact Information)
Table 20:Shimadzu Optical Spectrometers Product Features
Table 21:Shimadzu Optical Spectrometers Product Revenue (Million USD), Sales Volume (Units), Price (USD/Unit) and Gross Margin (2021-2025)
Table 22:PerkinElmer Basic Information (Total Revenue, Employees, Main Business, Service Area and Contact Information)
Table 23:PerkinElmer Optical Spectrometers Product Features
Table 24:PerkinElmer Optical Spectrometers Product Revenue (Million USD), Sales Volume (Units), Price (USD/Unit) and Gross Margin (2021-2025)
Table 25:Bruker Basic Information (Total Revenue, Employees, Main Business, Service Area and Contact Information)
Table 26:Bruker Optical Spectrometers Product Features
Table 27:Bruker Optical Spectrometers Product Revenue (Million USD), Sales Volume (Units), Price (USD/Unit) and Gross Margin (2021-2025)
Table 28:Olympus Basic Information (Total Revenue, Employees, Main Business, Service Area and Contact Information)
Table 29:Olympus Optical Spectrometers Product Features
Table 30:Olympus Optical Spectrometers Product Revenue (Million USD), Sales Volume (Units), Price (USD/Unit) and Gross Margin (2021-2025)
Table 31:Spectro Basic Information (Total Revenue, Employees, Main Business, Service Area and Contact Information)
Table 32:Spectro Optical Spectrometers Product Features
Table 33:Spectro Optical Spectrometers Product Revenue (Million USD), Sales Volume (Units), Price (USD/Unit) and Gross Margin (2021-2025)
Table 34:Horiba Basic Information (Total Revenue, Employees, Main Business, Service Area and Contact Information)
Table 35:Horiba Optical Spectrometers Product Features
Table 36:Horiba Optical Spectrometers Product Revenue (Million USD), Sales Volume (Units), Price (USD/Unit) and Gross Margin (2021-2025)
Table 37:Hitachi Basic Information (Total Revenue, Employees, Main Business, Service Area and Contact Information)
Table 38:Hitachi Optical Spectrometers Product Features
Table 39:Hitachi Optical Spectrometers Product Revenue (Million USD), Sales Volume (Units), Price (USD/Unit) and Gross Margin (2021-2025)
Table 40:Zolix Basic Information (Total Revenue, Employees, Main Business, Service Area and Contact Information)
Table 41:Zolix Optical Spectrometers Product Features
Table 42:Zolix Optical Spectrometers Product Revenue (Million USD), Sales Volume (Units), Price (USD/Unit) and Gross Margin (2021-2025)
Table 43:Skyray Instrument Basic Information (Total Revenue, Employees, Main Business, Service Area and Contact Information)
Table 44:Skyray Instrument Optical Spectrometers Product Features
Table 45:Skyray Instrument Optical Spectrometers Product Revenue (Million USD), Sales Volume (Units), Price (USD/Unit) and Gross Margin (2021-2025)
Table 46:Spectris Basic Information (Total Revenue, Employees, Main Business, Service Area and Contact Information)
Table 47:Spectris Optical Spectrometers Product Features
Table 48:Spectris Optical Spectrometers Product Revenue (Million USD), Sales Volume (Units), Price (USD/Unit) and Gross Margin (2021-2025)
Table 49:Hamamatsu Photonics Basic Information (Total Revenue, Employees, Main Business, Service Area and Contact Information)
Table 50:Hamamatsu Photonics Optical Spectrometers Product Features
Table 51:Hamamatsu Photonics Optical Spectrometers Product Revenue (Million USD), Sales Volume (Units), Price (USD/Unit) and Gross Margin (2021-2025)
Table 52:Ocean Optics Basic Information (Total Revenue, Employees, Main Business, Service Area and Contact Information)
Table 53:Ocean Optics Optical Spectrometers Product Features
Table 54:Ocean Optics Optical Spectrometers Product Revenue (Million USD), Sales Volume (Units), Price (USD/Unit) and Gross Margin (2021-2025)
Table 55:ABB Basic Information (Total Revenue, Employees, Main Business, Service Area and Contact Information)
Table 56:ABB Optical Spectrometers Product Features
Table 57:ABB Optical Spectrometers Product Revenue (Million USD), Sales Volume (Units), Price (USD/Unit) and Gross Margin (2021-2025)
Table 58:Ocean Insight Basic Information (Total Revenue, Employees, Main Business, Service Area and Contact Information)
Table 59:Ocean Insight Optical Spectrometers Product Features
Table 60:Ocean Insight Optical Spectrometers Product Revenue (Million USD), Sales Volume (Units), Price (USD/Unit) and Gross Margin (2021-2025)
Table 61:Viavi Basic Information (Total Revenue, Employees, Main Business, Service Area and Contact Information)
Table 62:Viavi Optical Spectrometers Product Features
Table 63:Viavi Optical Spectrometers Product Revenue (Million USD), Sales Volume (Units), Price (USD/Unit) and Gross Margin (2021-2025)
Table 64:Si-Ware Systems Basic Information (Total Revenue, Employees, Main Business, Service Area and Contact Information)
Table 65:Si-Ware Systems Optical Spectrometers Product Features
Table 66:Si-Ware Systems Optical Spectrometers Product Revenue (Million USD), Sales Volume (Units), Price (USD/Unit) and Gross Margin (2021-2025)
Table 67:Analytik Jena Basic Information (Total Revenue, Employees, Main Business, Service Area and Contact Information)
Table 68:Analytik Jena Optical Spectrometers Product Features
Table 69:Analytik Jena Optical Spectrometers Product Revenue (Million USD), Sales Volume (Units), Price (USD/Unit) and Gross Margin (2021-2025)
Table 70:B&W Tek Basic Information (Total Revenue, Employees, Main Business, Service Area and Contact Information)
Table 71:B&W Tek Optical Spectrometers Product Features
Table 72:B&W Tek Optical Spectrometers Product Revenue (Million USD), Sales Volume (Units), Price (USD/Unit) and Gross Margin (2021-2025)
Table 73:OTO Photonics Basic Information (Total Revenue, Employees, Main Business, Service Area and Contact Information)
Table 74:OTO Photonics Optical Spectrometers Product Features
Table 75:OTO Photonics Optical Spectrometers Product Revenue (Million USD), Sales Volume (Units), Price (USD/Unit) and Gross Margin (2021-2025)
Table 76:Global Optical Spectrometers Market Size and Growth Forecast by Countries (2020 VS 2025 VS 2032) & (Million USD)
Table 77:Global Optical Spectrometers Market Revenue by Countries (2020-2025) & (Million USD)
Table 78:Global Optical Spectrometers Market Share by Countries (2020-2025)
Table 79:Global Optical Spectrometers Market Revenue Forecast by Countries (2026-2032) & (Million USD)
Table 80:Global Optical Spectrometers Market Share Forecast by Countries (2026-2032)
Table 81:Global Optical Spectrometers Market Sales by Countries (2020-2025) & (Units)
Table 82:Global Optical Spectrometers Sales Volume Market Share by Countries (2020-2025)
Table 83:Global Optical Spectrometers Market Sales Volume Forecast by Countries (2026-2032) & (Units)
Table 84:Global Optical Spectrometers Sales Volume Market Share Forecast by Countries (2026-2032)
Table 85:Global Optical Spectrometers Market Revenue by Product Segment (2020-2025) & (Million USD)
Table 86:Global Optical Spectrometers Market Revenue Forecast by Product Segment (2026-2032) & (Million USD)
Table 87:Global Optical Spectrometers Market Sales Volume by Product Segment (2020-2025) & (Units)
Table 88:Global Optical Spectrometers Market Sales Volume Forecast by Product Segment (2026-2032) & (Units)
Table 89:Global Optical Spectrometers Market Revenue by Product Application (2020-2025) & (Million USD)
Table 90:Global Optical Spectrometers Market Revenue Forecast by Product Application (2026-2032) & (Million USD)
Table 91:Global Optical Spectrometers Market Sales Volume by Product Application (2020-2025) & (Units)
Table 92:Global Optical Spectrometers Market Sales Volume Forecast by Product Application (2026-2032) & (Units)
Table 93:United States Optical Spectrometers Market Revenue by Product Segment (2020-2025) & (Million USD)
Table 94:United States Optical Spectrometers Market Revenue Forecast by Product Segment (2026-2032) & (Million USD)
Table 95:United States Optical Spectrometers Market Sales Volume by Product Segment (2020-2025) & (Units)
Table 96:United States Optical Spectrometers Market Sales Volume Forecast by Segment (2026-2032) & (Units)
Table 97:United States Optical Spectrometers Market Revenue by Product Application (2020-2025) & (Million USD)
Table 98:United States Optical Spectrometers Market Revenue Forecast by Product Application (2026-2032) & (Million USD)
Table 99:United States Optical Spectrometers Market Sales Volume by Product Application (2020-2025) & (Units)
Table 100:United States Optical Spectrometers Market Sales Volume Forecast by Product Application (2026-2032) & (Units)
Table 101:China Optical Spectrometers Market Revenue by Product Segment (2020-2025) & (Million USD)
Table 102:China Optical Spectrometers Market Revenue Forecast by Product Segment (2026-2032) & (Million USD)
Table 103:China Optical Spectrometers Market Sales Volume by Product Segment (2020-2025) & (Units)
Table 104:China Optical Spectrometers Market Sales Volume Forecast by Segment (2026-2032) & (Units)
Table 105:China Optical Spectrometers Market Revenue by Product Application (2020-2025) & (Million USD)
Table 106:China Optical Spectrometers Market Revenue Forecast by Product Application (2026-2032) & (Million USD)
Table 107:China Optical Spectrometers Market Sales Volume by Product Application (2020-2025) & (Units)
Table 108:China Optical Spectrometers Market Sales Volume Forecast by Product Application (2026-2032) & (Units)
Table 109:Germany Optical Spectrometers Market Revenue by Product Segment (2020-2025) & (Million USD)
Table 110:Germany Optical Spectrometers Market Revenue Forecast by Product Segment (2026-2032) & (Million USD)
Table 111:Germany Optical Spectrometers Market Sales Volume by Product Segment (2020-2025) & (Units)
Table 112:Germany Optical Spectrometers Market Sales Volume Forecast by Segment (2026-2032) & (Units)
Table 113:Germany Optical Spectrometers Market Revenue by Product Application (2020-2025) & (Million USD)
Table 114:Germany Optical Spectrometers Market Revenue Forecast by Product Application (2026-2032) & (Million USD)
Table 115:Germany Optical Spectrometers Market Sales Volume by Product Application (2020-2025) & (Units)
Table 116:Germany Optical Spectrometers Market Sales Volume Forecast by Product Application (2026-2032) & (Units)
Table 117:Japan Optical Spectrometers Market Revenue by Product Segment (2020-2025) & (Million USD)
Table 118:Japan Optical Spectrometers Market Revenue Forecast by Product Segment (2026-2032) & (Million USD)
Table 119:Japan Optical Spectrometers Market Sales Volume by Product Segment (2020-2025) & (Units)
Table 120:Japan Optical Spectrometers Market Sales Volume Forecast by Segment (2026-2032) & (Units)
Table 121:Japan Optical Spectrometers Market Revenue by Product Application (2020-2025) & (Million USD)
Table 122:Japan Optical Spectrometers Market Revenue Forecast by Product Application (2026-2032) & (Million USD)
Table 123:Japan Optical Spectrometers Market Sales Volume by Product Application (2020-2025) & (Units)
Table 124:Japan Optical Spectrometers Market Sales Volume Forecast by Product Application (2026-2032) & (Units)
Table 125:France Optical Spectrometers Market Revenue by Product Segment (2020-2025) & (Million USD)
Table 126:France Optical Spectrometers Market Revenue Forecast by Product Segment (2026-2032) & (Million USD)
Table 127:France Optical Spectrometers Market Sales Volume by Product Segment (2020-2025) & (Units)
Table 128:France Optical Spectrometers Market Sales Volume Forecast by Segment (2026-2032) & (Units)
Table 129:France Optical Spectrometers Market Revenue by Product Application (2020-2025) & (Million USD)
Table 130:France Optical Spectrometers Market Revenue Forecast by Product Application (2026-2032) & (Million USD)
Table 131:France Optical Spectrometers Market Sales Volume by Product Application (2020-2025) & (Units)
Table 132:France Optical Spectrometers Market Sales Volume Forecast by Product Application (2026-2032) & (Units)
Table 133:South Korea Optical Spectrometers Market Revenue by Product Segment (2020-2025) & (Million USD)
Table 134:South Korea Optical Spectrometers Market Revenue Forecast by Product Segment (2026-2032) & (Million USD)
Table 135:South Korea Optical Spectrometers Market Sales Volume by Product Segment (2020-2025) & (Units)
Table 136:South Korea Optical Spectrometers Market Sales Volume Forecast by Segment (2026-2032) & (Units)
Table 137:South Korea Optical Spectrometers Market Revenue by Product Application (2020-2025) & (Million USD)
Table 138:South Korea Optical Spectrometers Market Revenue Forecast by Product Application (2026-2032) & (Million USD)
Table 139:South Korea Optical Spectrometers Market Sales Volume by Product Application (2020-2025) & (Units)
Table 140:South Korea Optical Spectrometers Market Sales Volume Forecast by Product Application (2026-2032) & (Units)
Table 141:United Kingdom Optical Spectrometers Market Revenue by Product Segment (2020-2025) & (Million USD)
Table 142:United Kingdom Optical Spectrometers Market Revenue Forecast by Product Segment (2026-2032) & (Million USD)
Table 143:United Kingdom Optical Spectrometers Market Sales Volume by Product Segment (2020-2025) & (Units)
Table 144:United Kingdom Optical Spectrometers Market Sales Volume Forecast by Segment (2026-2032) & (Units)
Table 145:United Kingdom Optical Spectrometers Market Revenue by Product Application (2020-2025) & (Million USD)
Table 146:United Kingdom Optical Spectrometers Market Revenue Forecast by Product Application (2026-2032) & (Million USD)
Table 147:United Kingdom Optical Spectrometers Market Sales Volume by Product Application (2020-2025) & (Units)
Table 148:United Kingdom Optical Spectrometers Market Sales Volume Forecast by Product Application (2026-2032) & (Units)
Table 149:India Optical Spectrometers Market Revenue by Product Segment (2020-2025) & (Million USD)
Table 150:India Optical Spectrometers Market Revenue Forecast by Product Segment (2026-2032) & (Million USD)
Table 151:India Optical Spectrometers Market Sales Volume by Product Segment (2020-2025) & (Units)
Table 152:India Optical Spectrometers Market Sales Volume Forecast by Segment (2026-2032) & (Units)
Table 153:India Optical Spectrometers Market Revenue by Product Application (2020-2025) & (Million USD)
Table 154:India Optical Spectrometers Market Revenue Forecast by Product Application (2026-2032) & (Million USD)
Table 155:India Optical Spectrometers Market Sales Volume by Product Application (2020-2025) & (Units)
Table 156:India Optical Spectrometers Market Sales Volume Forecast by Product Application (2026-2032) & (Units)
Table 157:Italy Optical Spectrometers Market Revenue by Product Segment (2020-2025) & (Million USD)
Table 158:Italy Optical Spectrometers Market Revenue Forecast by Product Segment (2026-2032) & (Million USD)
Table 159:Italy Optical Spectrometers Market Sales Volume by Product Segment (2020-2025) & (Units)
Table 160:Italy Optical Spectrometers Market Sales Volume Forecast by Segment (2026-2032) & (Units)
Table 161:Italy Optical Spectrometers Market Revenue by Product Application (2020-2025) & (Million USD)
Table 162:Italy Optical Spectrometers Market Revenue Forecast by Product Application (2026-2032) & (Million USD)
Table 163:Italy Optical Spectrometers Market Sales Volume by Product Application (2020-2025) & (Units)
Table 164:Italy Optical Spectrometers Market Sales Volume Forecast by Product Application (2026-2032) & (Units)
Table 165:Brazil Optical Spectrometers Market Revenue by Product Segment (2020-2025) & (Million USD)
Table 166:Brazil Optical Spectrometers Market Revenue Forecast by Product Segment (2026-2032) & (Million USD)
Table 167:Brazil Optical Spectrometers Market Sales Volume by Product Segment (2020-2025) & (Units)
Table 168:Brazil Optical Spectrometers Market Sales Volume Forecast by Segment (2026-2032) & (Units)
Table 169:Brazil Optical Spectrometers Market Revenue by Product Application (2020-2025) & (Million USD)
Table 170:Brazil Optical Spectrometers Market Revenue Forecast by Product Application (2026-2032) & (Million USD)
Table 171:Brazil Optical Spectrometers Market Sales Volume by Product Application (2020-2025) & (Units)
Table 172:Brazil Optical Spectrometers Market Sales Volume Forecast by Product Application (2026-2032) & (Units)
Table 173:Mexico Optical Spectrometers Market Revenue by Product Segment (2020-2025) & (Million USD)
Table 174:Mexico Optical Spectrometers Market Revenue Forecast by Product Segment (2026-2032) & (Million USD)
Table 175:Mexico Optical Spectrometers Market Sales Volume by Product Segment (2020-2025) & (Units)
Table 176:Mexico Optical Spectrometers Market Sales Volume Forecast by Segment (2026-2032) & (Units)
Table 177:Mexico Optical Spectrometers Market Revenue by Product Application (2020-2025) & (Million USD)
Table 178:Mexico Optical Spectrometers Market Revenue Forecast by Product Application (2026-2032) & (Million USD)
Table 179:Mexico Optical Spectrometers Market Sales Volume by Product Application (2020-2025) & (Units)
Table 180:Mexico Optical Spectrometers Market Sales Volume Forecast by Product Application (2026-2032) & (Units)
Table 181:Indonesia Optical Spectrometers Market Revenue by Product Segment (2020-2025) & (Million USD)
Table 182:Indonesia Optical Spectrometers Market Revenue Forecast by Product Segment (2026-2032) & (Million USD)
Table 183:Indonesia Optical Spectrometers Market Sales Volume by Product Segment (2020-2025) & (Units)
Table 184:Indonesia Optical Spectrometers Market Sales Volume Forecast by Segment (2026-2032) & (Units)
Table 185:Indonesia Optical Spectrometers Market Revenue by Product Application (2020-2025) & (Million USD)
Table 186:Indonesia Optical Spectrometers Market Revenue Forecast by Product Application (2026-2032) & (Million USD)
Table 187:Indonesia Optical Spectrometers Market Sales Volume by Product Application (2020-2025) & (Units)
Table 188:Indonesia Optical Spectrometers Market Sales Volume Forecast by Product Application (2026-2032) & (Units)
Table 189:Vietnam Optical Spectrometers Market Revenue by Product Segment (2020-2025) & (Million USD)
Table 190:Vietnam Optical Spectrometers Market Revenue Forecast by Product Segment (2026-2032) & (Million USD)
Table 191:Vietnam Optical Spectrometers Market Sales Volume by Product Segment (2020-2025) & (Units)
Table 192:Vietnam Optical Spectrometers Market Sales Volume Forecast by Segment (2026-2032) & (Units)
Table 193:Vietnam Optical Spectrometers Market Revenue by Product Application (2020-2025) & (Million USD)
Table 194:Vietnam Optical Spectrometers Market Revenue Forecast by Product Application (2026-2032) & (Million USD)
Table 195:Vietnam Optical Spectrometers Market Sales Volume by Product Application (2020-2025) & (Units)
Table 196:Vietnam Optical Spectrometers Market Sales Volume Forecast by Product Application (2026-2032) & (Units)
Table 197:South Africa Optical Spectrometers Market Revenue by Product Segment (2020-2025) & (Million USD)
Table 198:South Africa Optical Spectrometers Market Revenue Forecast by Product Segment (2026-2032) & (Million USD)
Table 199:South Africa Optical Spectrometers Market Sales Volume by Product Segment (2020-2025) & (Units)
Table 200:South Africa Optical Spectrometers Market Sales Volume Forecast by Segment (2026-2032) & (Units)
Table 201:South Africa Optical Spectrometers Market Revenue by Product Application (2020-2025) & (Million USD)
Table 202:South Africa Optical Spectrometers Market Revenue Forecast by Product Application (2026-2032) & (Million USD)
Table 203:South Africa Optical Spectrometers Market Sales Volume by Product Application (2020-2025) & (Units)
Table 204:South Africa Optical Spectrometers Market Sales Volume Forecast by Product Application (2026-2032) & (Units)
Table 205:Secondary Sources

Figure 1:Optical Spectrometers Product Scope
Figure 2:Global Optical Spectrometers Market Size and Growth Forecast Analysis (2020-2032) & (Million USD)
Figure 3:Global Optical Spectrometers Sales Volume and Growth Forecast Analysis (2020-2032) & (Units)
Figure 4:Global Optical Spectrometers Product Segment Market Share (2025 & 2032)
Figure 5:Global Optical Spectrometers Product Application Market Share (2025 & 2032)
Figure 6:Atomic spectrometry Product Scope
Figure 7:Molecular spectrometry Product Scope
Figure 8:Pharmaceuticals Product Scope
Figure 9:Food & Beverage Product Scope
Figure 10:Consumer Electronics Product Scope
Figure 11:Agriculture Product Scope
Figure 12:Medical Product Scope
Figure 13:Academia & Teaching Product Scope
Figure 14:Others Product Scope
Figure 15:Optical Spectrometers Industrial Chain Framework
Figure 16:Global Optical Spectrometers Market by Geographic Segmentation in 2025
Figure 17:Global Optical Spectrometers Market Share by Countries (2020 VS 2025)
Figure 18:Global Optical Spectrometers Sales Volume Market Share by Countries (2020 VS 2025)
Figure 19:United States Optical Spectrometers Market Size and Growth Forecast (2024 VS 2025 VS 2032) & (Million USD)
Figure 20:United States Optical Spectrometers Market Sales Volume and Growth Forecast (2020-2032) & (Units)
Figure 21:China Optical Spectrometers Market Size and Growth Forecast (2024 VS 2025 VS 2032) & (Million USD)
Figure 22:China Optical Spectrometers Market Sales Volume and Growth Forecast (2020-2032) & (Units)
Figure 23:Germany Optical Spectrometers Market Size and Growth Forecast (2024 VS 2025 VS 2032) & (Million USD)
Figure 24:Germany Optical Spectrometers Market Sales Volume and Growth Forecast (2020-2032) & (Units)
Figure 25:Japan Optical Spectrometers Market Size and Growth Forecast (2024 VS 2025 VS 2032) & (Million USD)
Figure 26:Japan Optical Spectrometers Market Sales Volume and Growth Forecast (2020-2032) & (Units)
Figure 27:France Optical Spectrometers Market Size and Growth Forecast (2024 VS 2025 VS 2032) & (Million USD)
Figure 28:France Optical Spectrometers Market Sales Volume and Growth Forecast (2020-2032) & (Units)
Figure 29:South Korea Optical Spectrometers Market Size and Growth Forecast (2024 VS 2025 VS 2032) & (Million USD)
Figure 30:South Korea Optical Spectrometers Market Sales Volume and Growth Forecast (2020-2032) & (Units)
Figure 31:United Kingdom Optical Spectrometers Market Size and Growth Forecast (2024 VS 2025 VS 2032) & (Million USD)
Figure 32:United Kingdom Optical Spectrometers Market Sales Volume and Growth Forecast (2020-2032) & (Units)
Figure 33:India Optical Spectrometers Market Size and Growth Forecast (2024 VS 2025 VS 2032) & (Million USD)
Figure 34:India Optical Spectrometers Market Sales Volume and Growth Forecast (2020-2032) & (Units)
Figure 35:Italy Optical Spectrometers Market Size and Growth Forecast (2024 VS 2025 VS 2032) & (Million USD)
Figure 36:Italy Optical Spectrometers Market Sales Volume and Growth Forecast (2020-2032) & (Units)
Figure 37:Brazil Optical Spectrometers Market Size and Growth Forecast (2024 VS 2025 VS 2032) & (Million USD)
Figure 38:Brazil Optical Spectrometers Market Sales Volume and Growth Forecast (2020-2032) & (Units)
Figure 39:Mexico Optical Spectrometers Market Size and Growth Forecast (2024 VS 2025 VS 2032) & (Million USD)
Figure 40:Mexico Optical Spectrometers Market Sales Volume and Growth Forecast (2020-2032) & (Units)
Figure 41:Indonesia Optical Spectrometers Market Size and Growth Forecast (2024 VS 2025 VS 2032) & (Million USD)
Figure 42:Indonesia Optical Spectrometers Market Sales Volume and Growth Forecast (2020-2032) & (Units)
Figure 43:Vietnam Optical Spectrometers Market Size and Growth Forecast (2024 VS 2025 VS 2032) & (Million USD)
Figure 44:Vietnam Optical Spectrometers Market Sales Volume and Growth Forecast (2020-2032) & (Units)
Figure 45:South Africa Optical Spectrometers Market Size and Growth Forecast (2024 VS 2025 VS 2032) & (Million USD)
Figure 46:South Africa Optical Spectrometers Market Sales Volume and Growth Forecast (2020-2032) & (Units)
Figure 47:Research Methodology
Figure 48:Primary Sources
Figure 49:Data Cross Validation
Global Optical Spectrometers Revenue and Market Share by Key Players
| Revenue (US$ Million) | 2020 | 2021 | 2022 | 2023 | 2024 |
| Thermo Scientific | XX | XX | XX | XX | XX |
| Agilent Technologies | XX | XX | XX | XX | XX |
| Shimadzu | XX | XX | XX | XX | XX |
| PerkinElmer | XX | XX | XX | XX | XX |
| Bruker | XX | XX | XX | XX | XX |
| Olympus | XX | XX | XX | XX | XX |
| Spectro | XX | XX | XX | XX | XX |
| Horiba | XX | XX | XX | XX | XX |
| Hitachi | XX | XX | XX | XX | XX |
| Zolix | XX | XX | XX | XX | XX |
| Skyray Instrument | XX | XX | XX | XX | XX |
| Spectris | XX | XX | XX | XX | XX |
| Hamamatsu Photonics | XX | XX | XX | XX | XX |
| Ocean Optics | XX | XX | XX | XX | XX |
| ABB | XX | XX | XX | XX | XX |
| Ocean Insight | XX | XX | XX | XX | XX |
| Viavi | XX | XX | XX | XX | XX |
| Si-Ware Systems | XX | XX | XX | XX | XX |
| Analytik Jena | XX | XX | XX | XX | XX |
| B&W Tek | XX | XX | XX | XX | XX |
| OTO Photonics | XX | XX | XX | XX | XX |
| Other Companies | XX | XX | XX | XX | XX |
| Total | XX | XX | XX | XX | XX |
Global Optical Spectrometers Sales Volume and Market Share by Key Players
| Sales (Units) | 2020 | 2021 | 2022 | 2023 | 2024 |
| Thermo Scientific | XX | XX | XX | XX | XX |
| Agilent Technologies | XX | XX | XX | XX | XX |
| Shimadzu | XX | XX | XX | XX | XX |
| PerkinElmer | XX | XX | XX | XX | XX |
| Bruker | XX | XX | XX | XX | XX |
| Olympus | XX | XX | XX | XX | XX |
| Spectro | XX | XX | XX | XX | XX |
| Horiba | XX | XX | XX | XX | XX |
| Hitachi | XX | XX | XX | XX | XX |
| Zolix | XX | XX | XX | XX | XX |
| Skyray Instrument | XX | XX | XX | XX | XX |
| Spectris | XX | XX | XX | XX | XX |
| Hamamatsu Photonics | XX | XX | XX | XX | XX |
| Ocean Optics | XX | XX | XX | XX | XX |
| ABB | XX | XX | XX | XX | XX |
| Ocean Insight | XX | XX | XX | XX | XX |
| Viavi | XX | XX | XX | XX | XX |
| Si-Ware Systems | XX | XX | XX | XX | XX |
| Analytik Jena | XX | XX | XX | XX | XX |
| B&W Tek | XX | XX | XX | XX | XX |
| OTO Photonics | XX | XX | XX | XX | XX |
| Other Companies | XX | XX | XX | XX | XX |
| Total | XX | XX | XX | XX | XX |


 English


 Related Reports


