Research Summary
Marine tourism, also known as maritime tourism or nautical tourism, refers to travel and recreational activities that are centered around coastal areas, oceans, rivers, and other bodies of water. It involves various activities and experiences designed to explore and enjoy the marine environment. Marine tourism encompasses a wide range of pursuits, including cruising, yachting, sailing, fishing, scuba diving, snorkeling, wildlife watching, water sports, and visiting coastal destinations. It offers opportunities to experience the beauty of marine ecosystems, appreciate diverse marine life, engage in water-based adventure, and relax on idyllic beaches. Marine tourism destinations often feature attractions such as coral reefs, marine parks, historic shipwrecks, coastal resorts, and cultural sites. This form of tourism not only provides recreational enjoyment but also contributes to the local economy, supports conservation efforts, and raises awareness about the importance of marine environments and sustainable practices.
According to WENKH research statistics, the global Marine Tourism market size will reach 97,917 Million USD in 2025 and is projected to reach 157,748 Million USD by 2032, with a CAGR of 7.05% (2025-2032). Among them, the Asia-Pacific Marine Tourism market is undergoing rapid changes, reaching Million USD in 2025, accounting for approximately % of the global market share. It is projected to reach Million USD by 2032.
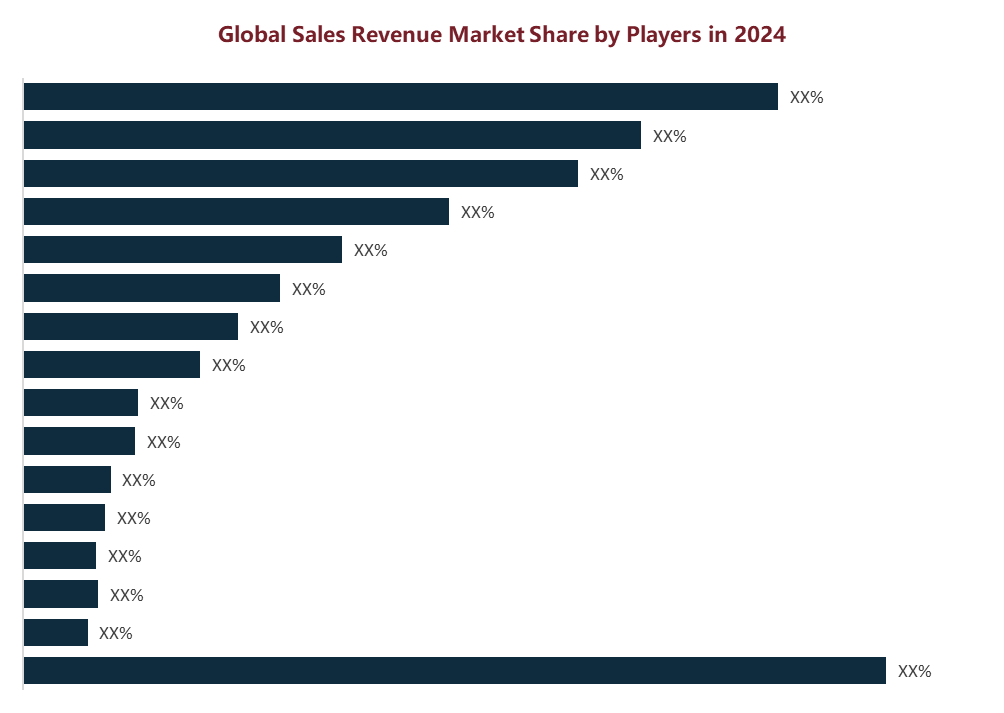
The global Marine Tourism market is highly competitive, with key market players including Carnival Corporation, Royal Caribbean, Norwegian Cruise Lines, MSC Cruises, Genting Hong Kong, Disney Cruise, Silversea Cruises (Royal), Dream Yacht Charter, etc. This report categorizes the competitive landscape of the global Marine Tourism market into three tiers based on annual revenue, with the top three market players holding approximately % of the total market share.
This report provides an in-depth analysis of the global Marine Tourism market, including market size, price trends, market status and future development prospects. It particularly focuses on the market share, product characteristics, pricing, sales revenue, and gross profit margin of major players in the global Marine Tourism industry. Additionally, this report provides an in-depth analysis of the market status and future development trends of different product segments of Marine Tourism and their downstream application fields.
In terms of data, this report includes a comprehensive time-series dataset. The historical data spans from 2020 to 2024, providing a solid foundation for analyzing past market trends. The year 2025 is used as a base year to accurately assess the current market landscape. Forecast data covers the period from 2026 to 2032, utilizing scientific analysis methods and models to offer forward-looking predictions and insights into the market's future development. This provides valuable reference information for industry participants and stakeholders.
The report covers countries including United States, China, Germany, Japan, France, South Korea, United Kingdom, India, Italy, Brazil, Mexico, Indonesia, Vietnam and South Africa. It particularly focuses on the sales revenue of Marine Tourism in these countries, as well as the product segmentation and downstream application market size of each country. The report provides an in-depth analysis of the regional distribution and future development trends of the Marine Tourism market. By considering local policies, this report evaluates the market prospects of Marine Tourism in each country, aiming to help companies gain a comprehensive understanding of the industry characteristics and development potential in different regions, optimize regional business layout, and develop precise market strategies to achieve global development goals.
This report places a strong emphasis on data quality and reliability, utilizing diverse and extensive data sources to ensure the accuracy and validity of the information presented. Primary data collection involves multiple channels, including in-depth interviews with senior executives, industry experts, supply chain stakeholders, and end consumers. These interviews provide key insights into corporate strategic planning, industry policy interpretation, supply chain dynamics, and end-user experiences. Secondary data sources cover a wide range of authoritative statistics from government agencies, customs databases, industry associations, third-party paid databases, brokerage research reports, academic research findings, corporate annual reports, financial statements, real-time news updates, and relevant information from international organizations. These data sources serve as a solid foundation for verification and analysis.
Companies Covered
Carnival Corporation
Royal Caribbean
Norwegian Cruise Lines
MSC Cruises
Genting Hong Kong
Disney Cruise
Silversea Cruises (Royal)
Dream Yacht Charter
Product Segment
Cruise Tourism
Yachting and Sailing Tourism
Others
Product Application
Passenger Tickets Service
Onboard and Other Service
Chapter Scope
Chapter 1: Product Statistical Scope, Product Segmentation Types and Downstream Applications, Overall Market Size, Current Status and Development Prospects
Chapter 2: Global Marine Tourism Industry Chain Analysis
Chapter 3: Global Marine Tourism Industry Environment Analysis and Porter's Five Forces Analysis
Chapter 4: Analysis of the Competitive Landscape of Major Companies in the Global Marine Tourism Market (Market Share, Product Revenue Comparison, Tier Division, Corporate Expansion and M&A Trends)
Chapter 5: Analysis of Global Major Companies (Company Profiles, Product Specifications and Features, Product Revenue and Product Gross Profit Margin)
Chapter 6: Global Marine Tourism Market Analysis by Countries, Product Segment and Downstream Application
Chapter 7: United States Marine Tourism Market Size, Product Segment, Downstream Application Analysis
Chapter 8: China Marine Tourism Market Size, Product Segment, Downstream Application Analysis
Chapter 9: Germany Marine Tourism Market Size, Product Segment, Downstream Application Analysis
Chapter 10: Japan Marine Tourism Market Size, Product Segment, Downstream Application Analysis
Chapter 11: France Marine Tourism Market Size, Product Segment, Downstream Application Analysis
Chapter 12: South Korea Marine Tourism Market Size, Product Segment, Downstream Application Analysis
Chapter 13: United Kingdom Marine Tourism Market Size, Product Segment, Downstream Application Analysis
Chapter 14: India Marine Tourism Market Size, Product Segment, Downstream Application Analysis
Chapter 15: Italy Marine Tourism Market Size, Product Segment, Downstream Application Analysis
Chapter 16: Brazil Marine Tourism Market Size, Product Segment, Downstream Application Analysis
Chapter 17: Mexico Marine Tourism Market Size, Product Segment, Downstream Application Analysis
Chapter 18: Indonesia Marine Tourism Market Size, Product Segment, Downstream Application Analysis
Chapter 19: Vietnam Marine Tourism Market Size, Product Segment, Downstream Application Analysis
Chapter 20: South Africa Marine Tourism Market Size, Product Segment, Downstream Application Analysis
Chapter 21: Research Conclusion
Chapter 22: Methodology and Data Source
Purpose and Value of the Report
Market Trend Insights: Analyze industry trends, market dynamics, and future growth potential to help companies forecast changes and develop strategic plans.
Competitive Landscape Analysis: Understand key players' revenue segmentation, strategies, market share, and business models to guide competitive decisions.
Investment Decision Support: Provide feasibility analysis through market size, growth rate, demand trends, and potential risks for informed investment decisions.
Target Customer and Demand Analysis: Examine consumer behavior, purchasing preferences, and pain points to optimize products and improve market penetration.
Policy and Regulatory Insights: Interpret relevant industry policies to ensure compliance and mitigate regulatory risks.
Business Model Optimization: Offer data-driven suggestions for enhancing business models and improving profitability.
Table of Content
1 Marine Tourism Market Overview
1.1 Product Definition Introduction
1.2 Global Marine Tourism Market Size and Growth Forecast Analysis (2020-2032)
1.3 Marine Tourism Market Status and Development Prospects
1.3.1 Marine Tourism Market Status
1.3.2 Marine Tourism Industry Development Prospects
1.4 Marine Tourism Market Overview by Product Segment
1.4.1 Global Marine Tourism Market Size and Growth Forecast Analysis by Product Segment: 2020 VS 2025 VS 2032
1.4.2 Cruise Tourism
1.4.3 Yachting and Sailing Tourism
1.4.4 Others
1.5 Marine Tourism Market Overview by Product Application
1.5.1 Global Marine Tourism Market Size and Growth Forecast Analysis by Product Application: 2020 VS 2025 VS 2032
1.5.2 Passenger Tickets Service
1.5.3 Onboard and Other Service
2 Marine Tourism Industry Supply Chain Analysis
2.1 Marine Tourism Supply Chain
2.2 Marine Tourism Midstream Suppliers
2.3 Marine Tourism Downstream Customers
2.4 Marine Tourism Sales Channel Analysis
3 Marine Tourism Market Environment Analysis
3.1 Marine Tourism Industry Policy Analysis
3.2 Marine Tourism Emerging Technology Trends in the Industry
3.3 Marine Tourism Restraining Factors Analysis
3.4 Marine Tourism Market Porter's Five Forces Analysis
3.4.1 Competitive Rivalry
3.4.2 Threat of New Entrants
3.4.3 Bargaining Power of Suppliers
3.4.4 Bargaining Power of Buyers
3.4.5 Threat of Substitute Products or Services
4 Global Marine Tourism Market Players Competition Landscape
4.1 Global Marine Tourism Market Revenue by Key Players (2021-2025)
4.2 Global Marine Tourism Market Position by Key Players
4.3 Global Key Players Headquarter and Key Area Served
4.4 Global Marine Tourism Market Expansion and M&A Dynamic
5 In-depth Analysis of Key Players
5.1 Carnival Corporation
5.1.1 Carnival Corporation Basic Information (Total Revenue, Employees, Main Business, Service Area and Contact Information)
5.1.2 Carnival Corporation Marine Tourism Product Features
5.1.3 Carnival Corporation Marine Tourism Product Revenue and Gross Margin Analysis (2021-2025)
5.2 Royal Caribbean
5.2.1 Royal Caribbean Basic Information (Total Revenue, Employees, Main Business, Service Area and Contact Information)
5.2.2 Royal Caribbean Marine Tourism Product Features
5.2.3 Royal Caribbean Marine Tourism Product Revenue and Gross Margin Analysis (2021-2025)
5.3 Norwegian Cruise Lines
5.3.1 Norwegian Cruise Lines Basic Information (Total Revenue, Employees, Main Business, Service Area and Contact Information)
5.3.2 Norwegian Cruise Lines Marine Tourism Product Features
5.3.3 Norwegian Cruise Lines Marine Tourism Product Revenue and Gross Margin Analysis (2021-2025)
5.4 MSC Cruises
5.4.1 MSC Cruises Basic Information (Total Revenue, Employees, Main Business, Service Area and Contact Information)
5.4.2 MSC Cruises Marine Tourism Product Features
5.4.3 MSC Cruises Marine Tourism Product Revenue and Gross Margin Analysis (2021-2025)
5.5 Genting Hong Kong
5.5.1 Genting Hong Kong Basic Information (Total Revenue, Employees, Main Business, Service Area and Contact Information)
5.5.2 Genting Hong Kong Marine Tourism Product Features
5.5.3 Genting Hong Kong Marine Tourism Product Revenue and Gross Margin Analysis (2021-2025)
5.6 Disney Cruise
5.6.1 Disney Cruise Basic Information (Total Revenue, Employees, Main Business, Service Area and Contact Information)
5.6.2 Disney Cruise Marine Tourism Product Features
5.6.3 Disney Cruise Marine Tourism Product Revenue and Gross Margin Analysis (2021-2025)
5.7 Silversea Cruises (Royal)
5.7.1 Silversea Cruises (Royal) Basic Information (Total Revenue, Employees, Main Business, Service Area and Contact Information)
5.7.2 Silversea Cruises (Royal) Marine Tourism Product Features
5.7.3 Silversea Cruises (Royal) Marine Tourism Product Revenue and Gross Margin Analysis (2021-2025)
5.8 Dream Yacht Charter
5.8.1 Dream Yacht Charter Basic Information (Total Revenue, Employees, Main Business, Service Area and Contact Information)
5.8.2 Dream Yacht Charter Marine Tourism Product Features
5.8.3 Dream Yacht Charter Marine Tourism Product Revenue and Gross Margin Analysis (2021-2025)
6 Global Marine Tourism Market Analysis by Countries, by Product Segment and Application
6.1 Global Marine Tourism Market Size and Growth Forecast by Countries: 2020 VS 2025 VS 2032
6.1.1 Global Marine Tourism Market Revenue by Countries (2020-2025)
6.1.2 Global Marine Tourism Market Revenue Forecast by Countries (2026-2032)
6.2 Global Marine Tourism Market Size by Product Segment (2020-2032)
6.3 Global Marine Tourism Market Size by Product Application (2020-2032)
7 United States Marine Tourism Market Analysis
7.1 United States Marine Tourism Market Prospects
7.2 United States Marine Tourism Market Size by Product Segment (2020-2032)
7.3 United States Marine Tourism Market Size by Product Application (2020-2032)
8 China Marine Tourism Market Analysis
8.1 China Marine Tourism Market Prospects
8.2 China Marine Tourism Market Size by Product Segment (2020-2032)
8.3 China Marine Tourism Market Size by Product Application (2020-2032)
9 Germany Marine Tourism Market Analysis
9.1 Germany Marine Tourism Market Prospects
9.2 Germany Marine Tourism Market Size by Product Segment (2020-2032)
9.3 Germany Marine Tourism Market Size by Product Application (2020-2032)
10 Japan Marine Tourism Market Analysis
10.1 Japan Marine Tourism Market Prospects
10.2 Japan Marine Tourism Market Size by Product Segment (2020-2032)
10.3 Japan Marine Tourism Market Size by Product Application (2020-2032)
11 France Marine Tourism Market Analysis
11.1 France Marine Tourism Market Prospects
11.2 France Marine Tourism Market Size by Product Segment (2020-2032)
11.3 France Marine Tourism Market Size by Product Application (2020-2032)
12 South Korea Marine Tourism Market Analysis
12.1 South Korea Marine Tourism Market Prospects
12.2 South Korea Marine Tourism Market Size by Product Segment (2020-2032)
12.3 South Korea Marine Tourism Market Size by Product Application (2020-2032)
13 United Kingdom Marine Tourism Market Analysis
13.1 United Kingdom Marine Tourism Market Prospects
13.2 United Kingdom Marine Tourism Market Size by Product Segment (2020-2032)
13.3 United Kingdom Marine Tourism Market Size by Product Application (2020-2032)
14 India Marine Tourism Market Analysis
14.1 India Marine Tourism Market Prospects
14.2 India Marine Tourism Market Size by Product Segment (2020-2032)
14.3 India Marine Tourism Market Size by Product Application (2020-2032)
15 Italy Marine Tourism Market Analysis
15.1 Italy Marine Tourism Market Prospects
15.2 Italy Marine Tourism Market Size by Product Segment (2020-2032)
15.3 Italy Marine Tourism Market Size by Product Application (2020-2032)
16 Brazil Marine Tourism Market Analysis
16.1 Brazil Marine Tourism Market Prospects
16.2 Brazil Marine Tourism Market Size by Product Segment (2020-2032)
16.3 Brazil Marine Tourism Market Size by Product Application (2020-2032)
17 Mexico Marine Tourism Market Analysis
17.1 Mexico Marine Tourism Market Prospects
17.2 Mexico Marine Tourism Market Size by Product Segment (2020-2032)
17.3 Mexico Marine Tourism Market Size by Product Application (2020-2032)
18 Indonesia Marine Tourism Market Analysis
18.1 Indonesia Marine Tourism Market Prospects
18.2 Indonesia Marine Tourism Market Size by Product Segment (2020-2032)
18.3 Indonesia Marine Tourism Market Size by Product Application (2020-2032)
19 Vietnam Marine Tourism Market Analysis
19.1 Vietnam Marine Tourism Market Prospects
19.2 Vietnam Marine Tourism Market Size by Product Segment (2020-2032)
19.3 Vietnam Marine Tourism Market Size by Product Application (2020-2032)
20 South Africa Marine Tourism Market Analysis
20.1 South Africa Marine Tourism Market Prospects
20.2 South Africa Marine Tourism Market Size by Product Segment (2020-2032)
20.3 South Africa Marine Tourism Market Size by Product Application (2020-2032)
21 Research Conclusion
22 Appendix
22.1 Methodology/Research Approach
22.2 Research Landscape
22.3 Research Benchmark and Hypothesis
22.4 Data Source
22.4.1 Primary Sources
22.4.2 Secondary Sources
22.5 Data Cross Validation
22.6 Disclaimer

Table 1:Global Marine Tourism Market Size and Growth Forecast Analysis by Product Segment (2020 VS 2025 VS 2032) & (Million USD)
Table 2:Global Marine Tourism Market Size and Growth Forecast Analysis by Product Application (2020 VS 2025 VS 2032) & (Million USD)
Table 3:Marine Tourism Downstream Customers List
Table 4:Marine Tourism Distributors/Dealers List
Table 5:Global Marine Tourism Market Revenue by Key Players (2021-2025) & (Million USD)
Table 6:Global Marine Tourism Market Position by Key Players
Table 7:Global Key Players Headquarter and Key Area Served
Table 8:Global Marine Tourism Market Expansion and M&A Dynamic
Table 9:Carnival Corporation Basic Information (Total Revenue, Employees, Main Business, Service Area and Contact Information)
Table 10:Carnival Corporation Marine Tourism Product Features
Table 11:Carnival Corporation Marine Tourism Revenue (Million USD) and Gross Margin (2021-2025)
Table 12:Royal Caribbean Basic Information (Total Revenue, Employees, Main Business, Service Area and Contact Information)
Table 13:Royal Caribbean Marine Tourism Product Features
Table 14:Royal Caribbean Marine Tourism Revenue (Million USD) and Gross Margin (2021-2025)
Table 15:Norwegian Cruise Lines Basic Information (Total Revenue, Employees, Main Business, Service Area and Contact Information)
Table 16:Norwegian Cruise Lines Marine Tourism Product Features
Table 17:Norwegian Cruise Lines Marine Tourism Revenue (Million USD) and Gross Margin (2021-2025)
Table 18:MSC Cruises Basic Information (Total Revenue, Employees, Main Business, Service Area and Contact Information)
Table 19:MSC Cruises Marine Tourism Product Features
Table 20:MSC Cruises Marine Tourism Revenue (Million USD) and Gross Margin (2021-2025)
Table 21:Genting Hong Kong Basic Information (Total Revenue, Employees, Main Business, Service Area and Contact Information)
Table 22:Genting Hong Kong Marine Tourism Product Features
Table 23:Genting Hong Kong Marine Tourism Revenue (Million USD) and Gross Margin (2021-2025)
Table 24:Disney Cruise Basic Information (Total Revenue, Employees, Main Business, Service Area and Contact Information)
Table 25:Disney Cruise Marine Tourism Product Features
Table 26:Disney Cruise Marine Tourism Revenue (Million USD) and Gross Margin (2021-2025)
Table 27:Silversea Cruises (Royal) Basic Information (Total Revenue, Employees, Main Business, Service Area and Contact Information)
Table 28:Silversea Cruises (Royal) Marine Tourism Product Features
Table 29:Silversea Cruises (Royal) Marine Tourism Revenue (Million USD) and Gross Margin (2021-2025)
Table 30:Dream Yacht Charter Basic Information (Total Revenue, Employees, Main Business, Service Area and Contact Information)
Table 31:Dream Yacht Charter Marine Tourism Product Features
Table 32:Dream Yacht Charter Marine Tourism Revenue (Million USD) and Gross Margin (2021-2025)
Table 33:Global Marine Tourism Market Size and Growth Forecast by Countries (2020 VS 2025 VS 2032) & (Million USD)
Table 34:Global Marine Tourism Market Revenue by Countries (2020-2025) & (Million USD)
Table 35:Global Marine Tourism Market Share by Countries (2020-2025)
Table 36:Global Marine Tourism Market Revenue Forecast by Countries (2026-2032) & (Million USD)
Table 37:Global Marine Tourism Market Share Forecast by Countries (2026-2032)
Table 38:Global Marine Tourism Market Revenue by Product Segment (2020-2025) & (Million USD)
Table 39:Global Marine Tourism Market Revenue Forecast by Product Segment (2026-2032) & (Million USD)
Table 40:Global Marine Tourism Market Revenue by Product Application (2020-2025) & (Million USD)
Table 41:Global Marine Tourism Market Revenue Forecast by Product Application (2026-2032) & (Million USD)
Table 42:United States Marine Tourism Market Revenue by Product Segment (2020-2025) & (Million USD)
Table 43:United States Marine Tourism Market Revenue Forecast by Product Segment (2026-2032) & (Million USD)
Table 44:United States Marine Tourism Market Revenue by Product Application (2020-2025) & (Million USD)
Table 45:United States Marine Tourism Market Revenue Forecast by Product Application (2026-2032) & (Million USD)
Table 46:China Marine Tourism Market Revenue by Product Segment (2020-2025) & (Million USD)
Table 47:China Marine Tourism Market Revenue Forecast by Product Segment (2026-2032) & (Million USD)
Table 48:China Marine Tourism Market Revenue by Product Application (2020-2025) & (Million USD)
Table 49:China Marine Tourism Market Revenue Forecast by Product Application (2026-2032) & (Million USD)
Table 50:Germany Marine Tourism Market Revenue by Product Segment (2020-2025) & (Million USD)
Table 51:Germany Marine Tourism Market Revenue Forecast by Product Segment (2026-2032) & (Million USD)
Table 52:Germany Marine Tourism Market Revenue by Product Application (2020-2025) & (Million USD)
Table 53:Germany Marine Tourism Market Revenue Forecast by Product Application (2026-2032) & (Million USD)
Table 54:Japan Marine Tourism Market Revenue by Product Segment (2020-2025) & (Million USD)
Table 55:Japan Marine Tourism Market Revenue Forecast by Product Segment (2026-2032) & (Million USD)
Table 56:Japan Marine Tourism Market Revenue by Product Application (2020-2025) & (Million USD)
Table 57:Japan Marine Tourism Market Revenue Forecast by Product Application (2026-2032) & (Million USD)
Table 58:France Marine Tourism Market Revenue by Product Segment (2020-2025) & (Million USD)
Table 59:France Marine Tourism Market Revenue Forecast by Product Segment (2026-2032) & (Million USD)
Table 60:France Marine Tourism Market Revenue by Product Application (2020-2025) & (Million USD)
Table 61:France Marine Tourism Market Revenue Forecast by Product Application (2026-2032) & (Million USD)
Table 62:South Korea Marine Tourism Market Revenue by Product Segment (2020-2025) & (Million USD)
Table 63:South Korea Marine Tourism Market Revenue Forecast by Product Segment (2026-2032) & (Million USD)
Table 64:South Korea Marine Tourism Market Revenue by Product Application (2020-2025) & (Million USD)
Table 65:South Korea Marine Tourism Market Revenue Forecast by Product Application (2026-2032) & (Million USD)
Table 66:United Kingdom Marine Tourism Market Revenue by Product Segment (2020-2025) & (Million USD)
Table 67:United Kingdom Marine Tourism Market Revenue Forecast by Product Segment (2026-2032) & (Million USD)
Table 68:United Kingdom Marine Tourism Market Revenue by Product Application (2020-2025) & (Million USD)
Table 69:United Kingdom Marine Tourism Market Revenue Forecast by Product Application (2026-2032) & (Million USD)
Table 70:India Marine Tourism Market Revenue by Product Segment (2020-2025) & (Million USD)
Table 71:India Marine Tourism Market Revenue Forecast by Product Segment (2026-2032) & (Million USD)
Table 72:India Marine Tourism Market Revenue by Product Application (2020-2025) & (Million USD)
Table 73:India Marine Tourism Market Revenue Forecast by Product Application (2026-2032) & (Million USD)
Table 74:Italy Marine Tourism Market Revenue by Product Segment (2020-2025) & (Million USD)
Table 75:Italy Marine Tourism Market Revenue Forecast by Product Segment (2026-2032) & (Million USD)
Table 76:Italy Marine Tourism Market Revenue by Product Application (2020-2025) & (Million USD)
Table 77:Italy Marine Tourism Market Revenue Forecast by Product Application (2026-2032) & (Million USD)
Table 78:Brazil Marine Tourism Market Revenue by Product Segment (2020-2025) & (Million USD)
Table 79:Brazil Marine Tourism Market Revenue Forecast by Product Segment (2026-2032) & (Million USD)
Table 80:Brazil Marine Tourism Market Revenue by Product Application (2020-2025) & (Million USD)
Table 81:Brazil Marine Tourism Market Revenue Forecast by Product Application (2026-2032) & (Million USD)
Table 82:Mexico Marine Tourism Market Revenue by Product Segment (2020-2025) & (Million USD)
Table 83:Mexico Marine Tourism Market Revenue Forecast by Product Segment (2026-2032) & (Million USD)
Table 84:Mexico Marine Tourism Market Revenue by Product Application (2020-2025) & (Million USD)
Table 85:Mexico Marine Tourism Market Revenue Forecast by Product Application (2026-2032) & (Million USD)
Table 86:Indonesia Marine Tourism Market Revenue by Product Segment (2020-2025) & (Million USD)
Table 87:Indonesia Marine Tourism Market Revenue Forecast by Product Segment (2026-2032) & (Million USD)
Table 88:Indonesia Marine Tourism Market Revenue by Product Application (2020-2025) & (Million USD)
Table 89:Indonesia Marine Tourism Market Revenue Forecast by Product Application (2026-2032) & (Million USD)
Table 90:Vietnam Marine Tourism Market Revenue by Product Segment (2020-2025) & (Million USD)
Table 91:Vietnam Marine Tourism Market Revenue Forecast by Product Segment (2026-2032) & (Million USD)
Table 92:Vietnam Marine Tourism Market Revenue by Product Application (2020-2025) & (Million USD)
Table 93:Vietnam Marine Tourism Market Revenue Forecast by Product Application (2026-2032) & (Million USD)
Table 94:South Africa Marine Tourism Market Revenue by Product Segment (2020-2025) & (Million USD)
Table 95:South Africa Marine Tourism Market Revenue Forecast by Product Segment (2026-2032) & (Million USD)
Table 96:South Africa Marine Tourism Market Revenue by Product Application (2020-2025) & (Million USD)
Table 97:South Africa Marine Tourism Market Revenue Forecast by Product Application (2026-2032) & (Million USD)
Table 98:Secondary Sources

Figure 1:Marine Tourism Product Scope
Figure 2:Global Marine Tourism Market Size and Growth Forecast Analysis (2020-2032) & (Million USD)
Figure 3:Global Marine Tourism Product Segment Market Share (2025 & 2032)
Figure 4:Global Marine Tourism Product Application Market Share (2025 & 2032)
Figure 5:Cruise Tourism Product Scope
Figure 6:Yachting and Sailing Tourism Product Scope
Figure 7:Others Product Scope
Figure 8:Passenger Tickets Service Product Scope
Figure 9:Onboard and Other Service Product Scope
Figure 10:Marine Tourism Industrial Chain Framework
Figure 11:Global Marine Tourism Market by Geographic Segmentation in 2025
Figure 12:Global Marine Tourism Market Share by Countries (2020 VS 2025)
Figure 13:United States Marine Tourism Market Size and Growth Forecast (2024 VS 2025 VS 2032) & (Million USD)
Figure 14:China Marine Tourism Market Size and Growth Forecast (2024 VS 2025 VS 2032) & (Million USD)
Figure 15:Germany Marine Tourism Market Size and Growth Forecast (2024 VS 2025 VS 2032) & (Million USD)
Figure 16:Japan Marine Tourism Market Size and Growth Forecast (2024 VS 2025 VS 2032) & (Million USD)
Figure 17:France Marine Tourism Market Size and Growth Forecast (2024 VS 2025 VS 2032) & (Million USD)
Figure 18:South Korea Marine Tourism Market Size and Growth Forecast (2024 VS 2025 VS 2032) & (Million USD)
Figure 19:United Kingdom Marine Tourism Market Size and Growth Forecast (2024 VS 2025 VS 2032) & (Million USD)
Figure 20:India Marine Tourism Market Size and Growth Forecast (2024 VS 2025 VS 2032) & (Million USD)
Figure 21:Italy Marine Tourism Market Size and Growth Forecast (2024 VS 2025 VS 2032) & (Million USD)
Figure 22:Brazil Marine Tourism Market Size and Growth Forecast (2024 VS 2025 VS 2032) & (Million USD)
Figure 23:Mexico Marine Tourism Market Size and Growth Forecast (2024 VS 2025 VS 2032) & (Million USD)
Figure 24:Indonesia Marine Tourism Market Size and Growth Forecast (2024 VS 2025 VS 2032) & (Million USD)
Figure 25:Vietnam Marine Tourism Market Size and Growth Forecast (2024 VS 2025 VS 2032) & (Million USD)
Figure 26:South Africa Marine Tourism Market Size and Growth Forecast (2024 VS 2025 VS 2032) & (Million USD)
Figure 27:Research Methodology
Figure 28:Primary Sources
Figure 29:Data Cross Validation
Global Marine Tourism Revenue and Market Share by Key Players
| Revenue (US$ Million) | 2020 | 2021 | 2022 | 2023 | 2024 |
| Carnival Corporation | XX | XX | XX | XX | XX |
| Royal Caribbean | XX | XX | XX | XX | XX |
| Norwegian Cruise Lines | XX | XX | XX | XX | XX |
| MSC Cruises | XX | XX | XX | XX | XX |
| Genting Hong Kong | XX | XX | XX | XX | XX |
| Disney Cruise | XX | XX | XX | XX | XX |
| Silversea Cruises (Royal) | XX | XX | XX | XX | XX |
| Dream Yacht Charter | XX | XX | XX | XX | XX |
| Other Companies | XX | XX | XX | XX | XX |
| Total | XX | XX | XX | XX | XX |


 English


 Related Reports


