Research Summary
Electrolytic copper, also known as electrorefined copper or high-purity copper, is a high-quality copper material produced through the electrolytic refining process. In this method, impure copper is used as the anode, and a pure copper cathode is submerged in an electrolyte solution. When an electric current is applied, copper ions from the anode migrate through the solution to the cathode, where they are deposited as pure copper, effectively purifying the material. Electrolytic copper is prized for its exceptional electrical conductivity, thermal conductivity, and high chemical purity, making it a crucial material in various industries, including electronics, telecommunications, and electrical engineering, where the performance of copper is paramount for efficient and reliable applications.
According to WENKH research statistics, the global Electrolytic Copper market size will reach Million USD in 2025 and is projected to reach Million USD by 2032, with a CAGR of % (2025-2032). Among them, the Asia-Pacific Electrolytic Copper market is undergoing rapid changes, reaching Million USD in 2025, accounting for approximately % of the global market share. It is projected to reach Million USD by 2032.
China remains the dominant importer of Electrolytic Copper, driven by its expansive infrastructure projects, electric vehicle production, and robust manufacturing base. The country accounts for over 40% of global copper consumption, with key import sources including Chile, Peru, and the Democratic Republic of Congo. These countries possess some of the world’s largest copper reserves and have developed strong export-oriented mining operations. Chile, in particular, maintains long-standing trade ties with China, supported by favorable bilateral agreements and well-established logistics routes through Pacific ports. In contrast, Japan and South Korea also import substantial volumes, though their consumption is more closely tied to refined electronics and high-end industrial applications rather than mass infrastructure.
On the export front, Chile leads the global Electrolytic Copper supply chain, followed closely by Peru and Russia. These countries benefit from vertically integrated operations that streamline mining, smelting, and refining. Their export markets extend beyond Asia, with significant volumes directed to Europe and North America. The United States, while a moderate producer, increasingly imports refined copper to meet downstream manufacturing demand, especially in renewable energy and construction. Recent trade policy shifts and geopolitical developments have started to influence copper flow patterns, encouraging diversification of supply chains and strengthening regional partnerships. This evolving landscape highlights a growing emphasis on securing stable copper supplies amid the accelerating global energy transition.
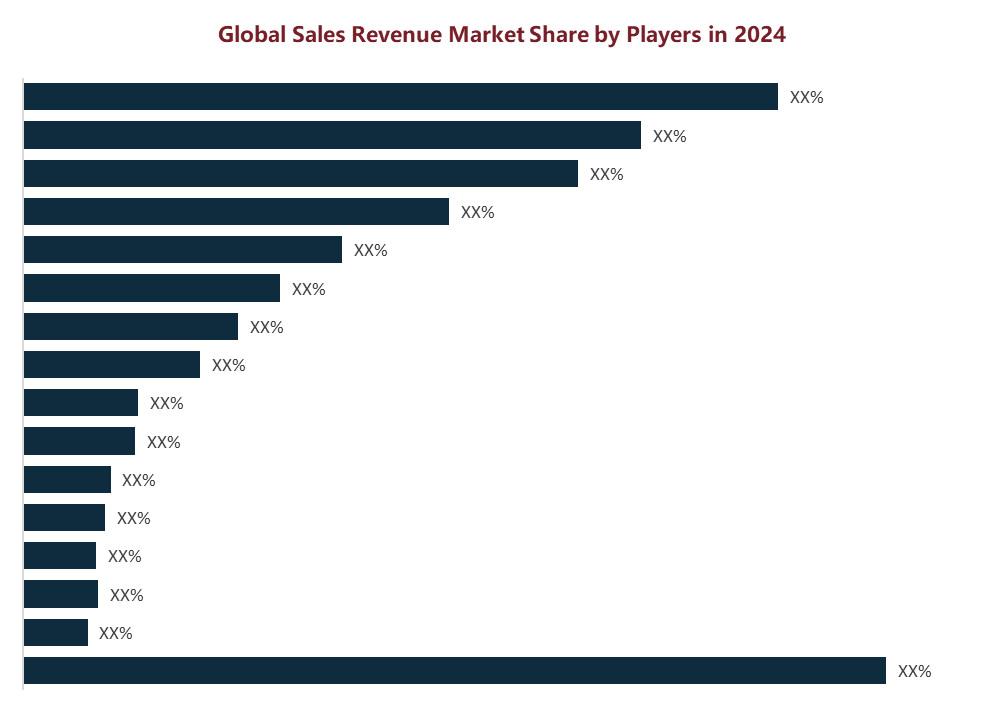
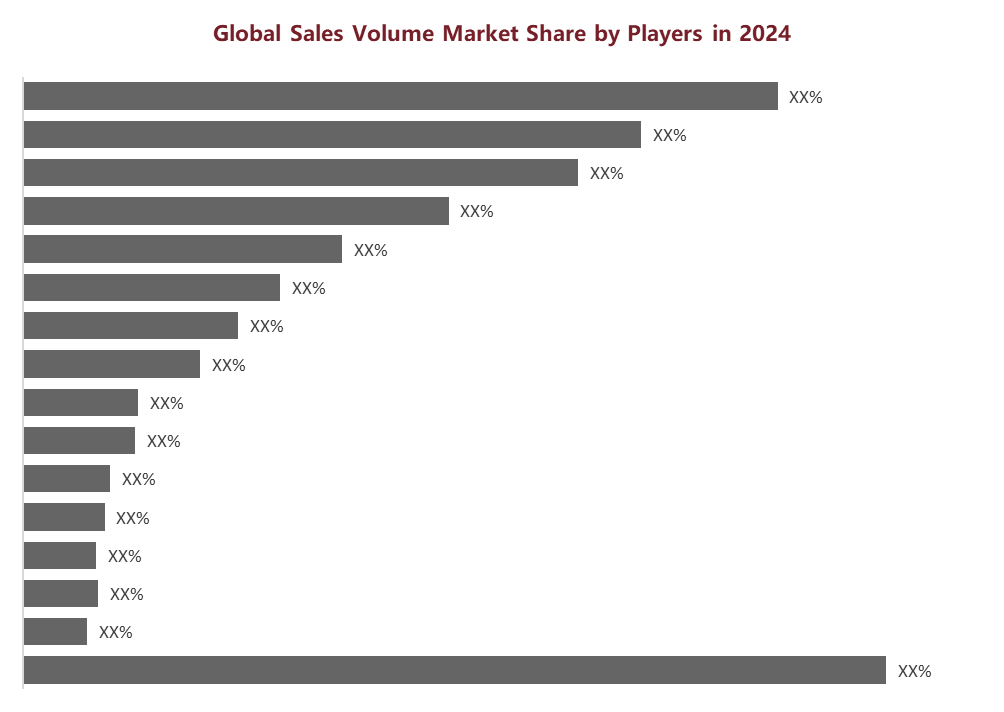
The global Electrolytic Copper market is highly competitive, with key market players including Jiangxi Copper, Tongling Nonferrous Metals, Yunnan Copper, Jinchuan, Daye Nonferrous Metals, Shandong Xiangguang, Henan Zhongyuan Gold Smelter, Shandong Fangyuan, ZTS Non-ferrous Metals, Baiyin Nonferrous, etc. This report categorizes the competitive landscape of the global Electrolytic Copper market into three tiers based on annual revenue, with the top three market players holding approximately % of the total market share.
This report provides an in-depth analysis of the global Electrolytic Copper market, including market size, capacity and production, price trends, market status and future development prospects. It particularly focuses on the market share, product characteristics, pricing, revenue, sales volume and gross profit margin of major manufacturers in the global Electrolytic Copper industry. Additionally, this report provides an in-depth analysis of the market status and future development trends of different segments of Electrolytic Copper and their downstream application fields.
In terms of data coverage, this report includes extensive time-series data. Historical data spans from 2020 to 2024, providing a solid foundation for analyzing market development trends. The year 2025 is used as a base year to accurately assess the current market landscape, while forecast data extends from 2026 to 2032, using scientific analysis methods and models to offer forward-looking projections and insights into the market's future trajectory. This provides valuable reference information for industry participants and stakeholders.
The report covers countries including United States, China, Germany, Japan, France, South Korea, United Kingdom, India, Italy, Brazil, Mexico, Indonesia, Vietnam and South Africa. It particularly focuses on the revenue and sales volume of Electrolytic Copper in these countries, as well as the product segmentation and downstream application market size of each country. The report provides an in-depth analysis of the regional distribution and future development trends of the Electrolytic Copper market. By considering local policies, this report evaluates the market prospects of Electrolytic Copper in each country, aiming to help companies gain a comprehensive understanding of the industry characteristics and development potential in different regions, optimize regional business layout, and develop precise market strategies to achieve global development goals.
This report places significant emphasis on data quality and reliability, leveraging a wide range of data sources to ensure accuracy and validity. Primary data collection is conducted through multiple channels, including in-depth interviews with senior corporate executives, industry experts, supply chain participants, and end consumers. This helps to gain insights into corporate strategic planning, industry policies, supply chain dynamics, and user experiences. Secondary data sources cover an extensive range, including authoritative government statistics, customs databases, industry related reports, third-party paid databases, investment research reports, academic studies, corporate financial statements, real-time media updates, and information from international organizations, all of which serve as a solid foundation for data verification and analysis.
Companies Covered
Jiangxi Copper
Tongling Nonferrous Metals
Yunnan Copper
Jinchuan
Daye Nonferrous Metals
Shandong Xiangguang
Henan Zhongyuan Gold Smelter
Shandong Fangyuan
ZTS Non-ferrous Metals
Baiyin Nonferrous
Product Segment
1# Standard Copper
2# Standard Copper
Grade A Copper
Product Application
Electric-Power Industry
Appliance Industry
Automotive and Transportation
Electronic
Construction
Chapter Scope
Chapter 1: Product Statistical Scope, Product Segmentation Types and Downstream Applications, Overall Market Size, Current Status and Development Prospects
Chapter 2: Global Electrolytic Copper Industry Chain Analysis
Chapter 3: Global Electrolytic Copper Industry Environment Analysis and Porter's Five Forces Analysis
Chapter 4: Global Electrolytic Copper Market Capacity and Production Analysis
Chapter 5: Analysis of the Competitive Landscape of Major Companies in the Global Electrolytic Copper Market (Market Share, Product Revenue and Sales Volume Comparison, Tier Division, Corporate Expansion and M&A Trends)
Chapter 6: Analysis of Global Major Companies (Company Profiles, Product Specifications and Features, Product Revenue, Product Sales Volume, Product Average Price and Product Gross Profit Margin)
Chapter 7: Global Electrolytic Copper Market Analysis by Countries, Product Segment and Downstream Application (Sales Volume, Revenue and Average Price)
Chapter 8: United States Electrolytic Copper Market Size, Product Segment, Downstream Application Analysis (Sales Volume, Revenue and Average Price)
Chapter 9: China Electrolytic Copper Market Size, Product Segment, Downstream Application Analysis (Sales Volume, Revenue and Average Price)
Chapter 10: Germany Electrolytic Copper Market Size, Product Segment, Downstream Application Analysis (Sales Volume, Revenue and Average Price)
Chapter 11: Japan Electrolytic Copper Market Size, Product Segment, Downstream Application Analysis (Sales Volume, Revenue and Average Price)
Chapter 12: France Electrolytic Copper Market Size, Product Segment, Downstream Application Analysis (Sales Volume, Revenue and Average Price)
Chapter 13: South Korea Electrolytic Copper Market Size, Product Segment, Downstream Application Analysis (Sales Volume, Revenue and Average Price)
Chapter 14: United Kingdom Electrolytic Copper Market Size, Product Segment, Downstream Application Analysis (Sales Volume, Revenue and Average Price)
Chapter 15: India Electrolytic Copper Market Size, Product Segment, Downstream Application Analysis (Sales Volume, Revenue and Average Price)
Chapter 16: Italy Electrolytic Copper Market Size, Product Segment, Downstream Application Analysis (Sales Volume, Revenue and Average Price)
Chapter 17: Brazil Electrolytic Copper Market Size, Product Segment, Downstream Application Analysis (Sales Volume, Revenue and Average Price)
Chapter 18: Mexico Electrolytic Copper Market Size, Product Segment, Downstream Application Analysis (Sales Volume, Revenue and Average Price)
Chapter 19: Indonesia Electrolytic Copper Market Size, Product Segment, Downstream Application Analysis (Sales Volume, Revenue and Average Price)
Chapter 20: Vietnam Electrolytic Copper Market Size, Product Segment, Downstream Application Analysis (Sales Volume, Revenue and Average Price)
Chapter 21: South Africa Electrolytic Copper Market Size, Product Segment, Downstream Application Analysis (Sales Volume, Revenue and Average Price)
Chapter 22: Research Conclusion
Chapter 23: Methodology and Data Source
Purpose and Value of the Report
Market Trend Insights: Analyze industry trends, market dynamics, and future growth potential to help companies forecast changes and develop strategic plans.
Competitive Landscape Analysis: Understand key players' revenue segmentation, strategies, market share, and business models to guide competitive decisions.
Investment Decision Support: Provide feasibility analysis through market size, growth rate, demand trends, and potential risks for informed investment decisions.
Target Customer and Demand Analysis: Examine consumer behavior, purchasing preferences, and pain points to optimize products and improve market penetration.
Policy and Regulatory Insights: Interpret relevant industry policies to ensure compliance and mitigate regulatory risks.
Business Model Optimization: Offer data-driven suggestions for enhancing business models and improving profitability.
Table of Content
1 Electrolytic Copper Market Overview
1.1 Product Definition Introduction
1.2 Global Electrolytic Copper Market Size and Growth Forecast Analysis (2020-2032)
1.3 Electrolytic Copper Market Status and Development Prospects
1.3.1 Electrolytic Copper Market Status
1.3.2 Electrolytic Copper Industry Development Prospects
1.4 Electrolytic Copper Market Overview by Product Segment
1.4.1 Global Electrolytic Copper Market Size and Growth Forecast Analysis by Product Segment: 2020 VS 2025 VS 2032
1.4.2 1# Standard Copper
1.4.3 2# Standard Copper
1.4.4 Grade A Copper
1.5 Electrolytic Copper Market Overview by Product Application
1.5.1 Global Electrolytic Copper Market Size and Growth Forecast Analysis by Product Application: 2020 VS 2025 VS 2032
1.5.2 Electric-Power Industry
1.5.3 Appliance Industry
1.5.4 Automotive and Transportation
1.5.5 Electronic
1.5.6 Construction
2 Electrolytic Copper Industry Supply Chain Analysis
2.1 Electrolytic Copper Supply Chain
2.2 Electrolytic Copper Industry Upstream Supply Analysis
2.2.1 Upstream Raw Materials Supply Status
2.2.2 Key Raw Material Suppliers
2.3 Electrolytic Copper Midstream Manufacturers
2.4 Electrolytic Copper Downstream Customers
2.5 Electrolytic Copper Sales Channel Analysis
3 Electrolytic Copper Market Environment Analysis
3.1 Electrolytic Copper Industry Policy Analysis
3.2 Electrolytic Copper Emerging Technology Trends in the Industry
3.3 Electrolytic Copper Restraining Factors Analysis
3.4 Electrolytic Copper Market Porter's Five Forces Analysis
3.4.1 Competitive Rivalry
3.4.2 Threat of New Entrants
3.4.3 Bargaining Power of Suppliers
3.4.4 Bargaining Power of Buyers
3.4.5 Threat of Substitute Products or Services
4 Global Electrolytic Copper Capacity, Production and Market Demand Analysis
4.1 Global Electrolytic Copper Capacity and Production Analysis (2020-2032)
4.2 Global Electrolytic Copper Capacity and Production by Countries (2020-2025)
5 Global Electrolytic Copper Manufacturer Competition Landscape
5.1 Global Electrolytic Copper Market Sales Volume, Revenue by Key Manufacturers (2021-2025)
5.1.1 Global Electrolytic Copper Market Sales Volume by Key Manufacturers (2021-2025)
5.1.2 Global Electrolytic Copper Market Revenue by Key Manufacturers (2021-2025)
5.2 Global Electrolytic Copper Market Position by Key Manufacturers
5.3 China Electrolytic Copper Market Position by Key Manufacturers
5.4 Global Key Manufacturers Headquarter and Key Area Served
5.5 Global Electrolytic Copper Market Expansion and M&A Dynamic
6 In-depth Analysis of Key Players
6.1 Jiangxi Copper
6.1.1 Jiangxi Copper Basic Information (Total Revenue, Employees, Main Business, Service Area and Contact Information)
6.1.2 Jiangxi Copper Electrolytic Copper Product Features
6.1.3 Jiangxi Copper Electrolytic Copper Product Revenue, Sales Volume, Price and Gross Margin Analysis (2021-2025)
6.2 Tongling Nonferrous Metals
6.2.1 Tongling Nonferrous Metals Basic Information (Total Revenue, Employees, Main Business, Service Area and Contact Information)
6.2.2 Tongling Nonferrous Metals Electrolytic Copper Product Features
6.2.3 Tongling Nonferrous Metals Electrolytic Copper Product Revenue, Sales Volume, Price and Gross Margin Analysis (2021-2025)
6.3 Yunnan Copper
6.3.1 Yunnan Copper Basic Information (Total Revenue, Employees, Main Business, Service Area and Contact Information)
6.3.2 Yunnan Copper Electrolytic Copper Product Features
6.3.3 Yunnan Copper Electrolytic Copper Product Revenue, Sales Volume, Price and Gross Margin Analysis (2021-2025)
6.4 Jinchuan
6.4.1 Jinchuan Basic Information (Total Revenue, Employees, Main Business, Service Area and Contact Information)
6.4.2 Jinchuan Electrolytic Copper Product Features
6.4.3 Jinchuan Electrolytic Copper Product Revenue, Sales Volume, Price and Gross Margin Analysis (2021-2025)
6.5 Daye Nonferrous Metals
6.5.1 Daye Nonferrous Metals Basic Information (Total Revenue, Employees, Main Business, Service Area and Contact Information)
6.5.2 Daye Nonferrous Metals Electrolytic Copper Product Features
6.5.3 Daye Nonferrous Metals Electrolytic Copper Product Revenue, Sales Volume, Price and Gross Margin Analysis (2021-2025)
6.6 Shandong Xiangguang
6.6.1 Shandong Xiangguang Basic Information (Total Revenue, Employees, Main Business, Service Area and Contact Information)
6.6.2 Shandong Xiangguang Electrolytic Copper Product Features
6.6.3 Shandong Xiangguang Electrolytic Copper Product Revenue, Sales Volume, Price and Gross Margin Analysis (2021-2025)
6.7 Henan Zhongyuan Gold Smelter
6.7.1 Henan Zhongyuan Gold Smelter Basic Information (Total Revenue, Employees, Main Business, Service Area and Contact Information)
6.7.2 Henan Zhongyuan Gold Smelter Electrolytic Copper Product Features
6.7.3 Henan Zhongyuan Gold Smelter Electrolytic Copper Product Revenue, Sales Volume, Price and Gross Margin Analysis (2021-2025)
6.8 Shandong Fangyuan
6.8.1 Shandong Fangyuan Basic Information (Total Revenue, Employees, Main Business, Service Area and Contact Information)
6.8.2 Shandong Fangyuan Electrolytic Copper Product Features
6.8.3 Shandong Fangyuan Electrolytic Copper Product Revenue, Sales Volume, Price and Gross Margin Analysis (2021-2025)
6.9 ZTS Non-ferrous Metals
6.9.1 ZTS Non-ferrous Metals Basic Information (Total Revenue, Employees, Main Business, Service Area and Contact Information)
6.9.2 ZTS Non-ferrous Metals Electrolytic Copper Product Features
6.9.3 ZTS Non-ferrous Metals Electrolytic Copper Product Revenue, Sales Volume, Price and Gross Margin Analysis (2021-2025)
6.10 Baiyin Nonferrous
6.10.1 Baiyin Nonferrous Basic Information (Total Revenue, Employees, Main Business, Service Area and Contact Information)
6.10.2 Baiyin Nonferrous Electrolytic Copper Product Features
6.10.3 Baiyin Nonferrous Electrolytic Copper Product Revenue, Sales Volume, Price and Gross Margin Analysis (2021-2025)
7 Global Electrolytic Copper Market Analysis by Countries, by Product Segment and Application
7.1 Global Electrolytic Copper Market Size and Growth Forecast by Countries: 2020 VS 2025 VS 2032
7.1.1 Global Electrolytic Copper Market Revenue by Countries (2020-2025)
7.1.2 Global Electrolytic Copper Market Revenue Forecast by Countries (2026-2032)
7.2 Global Electrolytic Copper Market Sales Volume Analysis
7.2.1 Global Electrolytic Copper Market Sales Volume by Countries (2020-2025)
7.2.2 Global Electrolytic Copper Market Sales Volume Forecast by Countries (2026-2032)
7.3 Global Electrolytic Copper Market by Product Segment (2020-2032)
7.3.1 Global Electrolytic Copper Market Revenue and Forecast by Product Segment
7.3.2 Global Electrolytic Copper Market Sales Volume and Forecast by Product Segment
7.4 Global Electrolytic Copper Market by Product Application (2020-2032)
7.4.1 Global Electrolytic Copper Market Revenue and Forecast by Product Application
7.4.2 Global Electrolytic Copper Market Sales Volume and Forecast by Product Application
8 United States Electrolytic Copper Market Analysis
8.1 United States Electrolytic Copper Market Prospects
8.1.1 United States Electrolytic Copper Revenue and Growth Forecast (2020-2032)
8.1.2 United States Electrolytic Copper Market Sales Volume and Growth Forecast (2020-2032)
8.2 United States Electrolytic Copper Market by Product Segment (2020-2032)
8.2.1 United States Electrolytic Copper Market Revenue and Forecast Analysis by Product Segment
8.2.2 United States Electrolytic Copper Market Sales Volume and Forecast Analysis by Product Segment
8.3 United States Electrolytic Copper Market by Product Application (2020-2032)
8.3.1 United States Electrolytic Copper Market Revenue and Forecast Analysis by Product Application
8.3.2 United States Electrolytic Copper Market Sales Volume and Forecast Analysis by Product Application
9 China Electrolytic Copper Market Analysis
9.1 China Electrolytic Copper Market Prospects
9.1.1 China Electrolytic Copper Revenue and Growth Forecast (2020-2032)
9.1.2 China Electrolytic Copper Market Sales Volume and Growth Forecast (2020-2032)
9.2 China Electrolytic Copper Market by Product Segment (2020-2032)
9.2.1 China Electrolytic Copper Market Revenue and Forecast Analysis by Product Segment
9.2.2 China Electrolytic Copper Market Sales Volume and Forecast Analysis by Product Segment
9.3 China Electrolytic Copper Market by Product Application (2020-2032)
9.3.1 China Electrolytic Copper Market Revenue and Forecast Analysis by Product Application
9.3.2 China Electrolytic Copper Market Sales Volume and Forecast Analysis by Product Application
10 Germany Electrolytic Copper Market Analysis
10.1 Germany Electrolytic Copper Market Prospects
10.1.1 Germany Electrolytic Copper Revenue and Growth Forecast (2020-2032)
10.1.2 Germany Electrolytic Copper Market Sales Volume and Growth Forecast (2020-2032)
10.2 Germany Electrolytic Copper Market by Product Segment (2020-2032)
10.2.1 Germany Electrolytic Copper Market Revenue and Forecast Analysis by Product Segment
10.2.2 Germany Electrolytic Copper Market Sales Volume and Forecast Analysis by Product Segment
10.3 Germany Electrolytic Copper Market by Product Application (2020-2032)
10.3.1 Germany Electrolytic Copper Market Revenue and Forecast Analysis by Product Application
10.3.2 Germany Electrolytic Copper Market Sales Volume and Forecast Analysis by Product Application
11 Japan Electrolytic Copper Market Analysis
11.1 Japan Electrolytic Copper Market Prospects
11.1.1 Japan Electrolytic Copper Revenue and Growth Forecast (2020-2032)
11.1.2 Japan Electrolytic Copper Market Sales Volume and Growth Forecast (2020-2032)
11.2 Japan Electrolytic Copper Market by Product Segment (2020-2032)
11.2.1 Japan Electrolytic Copper Market Revenue and Forecast Analysis by Product Segment
11.2.2 Japan Electrolytic Copper Market Sales Volume and Forecast Analysis by Product Segment
11.3 Japan Electrolytic Copper Market by Product Application (2020-2032)
11.3.1 Japan Electrolytic Copper Market Revenue and Forecast Analysis by Product Application
11.3.2 Japan Electrolytic Copper Market Sales Volume and Forecast Analysis by Product Application
12 France Electrolytic Copper Market Analysis
12.1 France Electrolytic Copper Market Prospects
12.1.1 France Electrolytic Copper Revenue and Growth Forecast (2020-2032)
12.1.2 France Electrolytic Copper Market Sales Volume and Growth Forecast (2020-2032)
12.2 France Electrolytic Copper Market by Product Segment (2020-2032)
12.2.1 France Electrolytic Copper Market Revenue and Forecast Analysis by Product Segment
12.2.2 France Electrolytic Copper Market Sales Volume and Forecast Analysis by Product Segment
12.3 France Electrolytic Copper Market by Product Application (2020-2032)
12.3.1 France Electrolytic Copper Market Revenue and Forecast Analysis by Product Application
12.3.2 France Electrolytic Copper Market Sales Volume and Forecast Analysis by Product Application
13 South Korea Electrolytic Copper Market Analysis
13.1 South Korea Electrolytic Copper Market Prospects
13.1.1 South Korea Electrolytic Copper Revenue and Growth Forecast (2020-2032)
13.1.2 South Korea Electrolytic Copper Market Sales Volume and Growth Forecast (2020-2032)
13.2 South Korea Electrolytic Copper Market by Product Segment (2020-2032)
13.2.1 South Korea Electrolytic Copper Market Revenue and Forecast Analysis by Product Segment
13.2.2 South Korea Electrolytic Copper Market Sales Volume and Forecast Analysis by Product Segment
13.3 South Korea Electrolytic Copper Market by Product Application (2020-2032)
13.3.1 South Korea Electrolytic Copper Market Revenue and Forecast Analysis by Product Application
13.3.2 South Korea Electrolytic Copper Market Sales Volume and Forecast Analysis by Product Application
14 United Kingdom Electrolytic Copper Market Analysis
14.1 United Kingdom Electrolytic Copper Market Prospects
14.1.1 United Kingdom Electrolytic Copper Revenue and Growth Forecast (2020-2032)
14.1.2 United Kingdom Electrolytic Copper Market Sales Volume and Growth Forecast (2020-2032)
14.2 United Kingdom Electrolytic Copper Market by Product Segment (2020-2032)
14.2.1 United Kingdom Electrolytic Copper Market Revenue and Forecast Analysis by Product Segment
14.2.2 United Kingdom Electrolytic Copper Market Sales Volume and Forecast Analysis by Product Segment
14.3 United Kingdom Electrolytic Copper Market by Product Application (2020-2032)
14.3.1 United Kingdom Electrolytic Copper Market Revenue and Forecast Analysis by Product Application
14.3.2 United Kingdom Electrolytic Copper Market Sales Volume and Forecast Analysis by Product Application
15 India Electrolytic Copper Market Analysis
15.1 India Electrolytic Copper Market Prospects
15.1.1 India Electrolytic Copper Revenue and Growth Forecast (2020-2032)
15.1.2 India Electrolytic Copper Market Sales Volume and Growth Forecast (2020-2032)
15.2 India Electrolytic Copper Market by Product Segment (2020-2032)
15.2.1 India Electrolytic Copper Market Revenue and Forecast Analysis by Product Segment
15.2.2 India Electrolytic Copper Market Sales Volume and Forecast Analysis by Product Segment
15.3 India Electrolytic Copper Market by Product Application (2020-2032)
15.3.1 India Electrolytic Copper Market Revenue and Forecast Analysis by Product Application
15.3.2 India Electrolytic Copper Market Sales Volume and Forecast Analysis by Product Application
16 Italy Electrolytic Copper Market Analysis
16.1 Italy Electrolytic Copper Market Prospects
16.1.1 Italy Electrolytic Copper Revenue and Growth Forecast (2020-2032)
16.1.2 Italy Electrolytic Copper Market Sales Volume and Growth Forecast (2020-2032)
16.2 Italy Electrolytic Copper Market by Product Segment (2020-2032)
16.2.1 Italy Electrolytic Copper Market Revenue and Forecast Analysis by Product Segment
16.2.2 Italy Electrolytic Copper Market Sales Volume and Forecast Analysis by Product Segment
16.3 Italy Electrolytic Copper Market by Product Application (2020-2032)
16.3.1 Italy Electrolytic Copper Market Revenue and Forecast Analysis by Product Application
16.3.2 Italy Electrolytic Copper Market Sales Volume and Forecast Analysis by Product Application
17 Brazil Electrolytic Copper Market Analysis
17.1 Brazil Electrolytic Copper Market Prospects
17.1.1 Brazil Electrolytic Copper Revenue and Growth Forecast (2020-2032)
17.1.2 Brazil Electrolytic Copper Market Sales Volume and Growth Forecast (2020-2032)
17.2 Brazil Electrolytic Copper Market by Product Segment (2020-2032)
17.2.1 Brazil Electrolytic Copper Market Revenue and Forecast Analysis by Product Segment
17.2.2 Brazil Electrolytic Copper Market Sales Volume and Forecast Analysis by Product Segment
17.3 Brazil Electrolytic Copper Market by Product Application (2020-2032)
17.3.1 Brazil Electrolytic Copper Market Revenue and Forecast Analysis by Product Application
17.3.2 Brazil Electrolytic Copper Market Sales Volume and Forecast Analysis by Product Application
18 Mexico Electrolytic Copper Market Analysis
18.1 Mexico Electrolytic Copper Market Prospects
18.1.1 Mexico Electrolytic Copper Revenue and Growth Forecast (2020-2032)
18.1.2 Mexico Electrolytic Copper Market Sales Volume and Growth Forecast (2020-2032)
18.2 Mexico Electrolytic Copper Market by Product Segment (2020-2032)
18.2.1 Mexico Electrolytic Copper Market Revenue and Forecast Analysis by Product Segment
18.2.2 Mexico Electrolytic Copper Market Sales Volume and Forecast Analysis by Product Segment
18.3 Mexico Electrolytic Copper Market by Product Application (2020-2032)
18.3.1 Mexico Electrolytic Copper Market Revenue and Forecast Analysis by Product Application
18.3.2 Mexico Electrolytic Copper Market Sales Volume and Forecast Analysis by Product Application
19 Indonesia Electrolytic Copper Market Analysis
19.1 Indonesia Electrolytic Copper Market Prospects
19.1.1 Indonesia Electrolytic Copper Revenue and Growth Forecast (2020-2032)
19.1.2 Indonesia Electrolytic Copper Market Sales Volume and Growth Forecast (2020-2032)
19.2 Indonesia Electrolytic Copper Market by Product Segment (2020-2032)
19.2.1 Indonesia Electrolytic Copper Market Revenue and Forecast Analysis by Product Segment
19.2.2 Indonesia Electrolytic Copper Market Sales Volume and Forecast Analysis by Product Segment
19.3 Indonesia Electrolytic Copper Market by Product Application (2020-2032)
19.3.1 Indonesia Electrolytic Copper Market Revenue and Forecast Analysis by Product Application
19.3.2 Indonesia Electrolytic Copper Market Sales Volume and Forecast Analysis by Product Application
20 Vietnam Electrolytic Copper Market Analysis
20.1 Vietnam Electrolytic Copper Market Prospects
20.1.1 Vietnam Electrolytic Copper Revenue and Growth Forecast (2020-2032)
20.1.2 Vietnam Electrolytic Copper Market Sales Volume and Growth Forecast (2020-2032)
20.2 Vietnam Electrolytic Copper Market by Product Segment (2020-2032)
20.2.1 Vietnam Electrolytic Copper Market Revenue and Forecast Analysis by Product Segment
20.2.2 Vietnam Electrolytic Copper Market Sales Volume and Forecast Analysis by Product Segment
20.3 Vietnam Electrolytic Copper Market by Product Application (2020-2032)
20.3.1 Vietnam Electrolytic Copper Market Revenue and Forecast Analysis by Product Application
20.3.2 Vietnam Electrolytic Copper Market Sales Volume and Forecast Analysis by Product Application
21 South Africa Electrolytic Copper Market Analysis
21.1 South Africa Electrolytic Copper Market Prospects
21.1.1 South Africa Electrolytic Copper Revenue and Growth Forecast (2020-2032)
21.1.2 South Africa Electrolytic Copper Market Sales Volume and Growth Forecast (2020-2032)
21.2 South Africa Electrolytic Copper Market by Product Segment (2020-2032)
21.2.1 South Africa Electrolytic Copper Market Revenue and Forecast Analysis by Product Segment
21.2.2 South Africa Electrolytic Copper Market Sales Volume and Forecast Analysis by Product Segment
21.3 South Africa Electrolytic Copper Market by Product Application (2020-2032)
21.3.1 South Africa Electrolytic Copper Market Revenue and Forecast Analysis by Product Application
21.3.2 South Africa Electrolytic Copper Market Sales Volume and Forecast Analysis by Product Application
22 Research Conclusion
23 Appendix
23.1 Methodology/Research Approach
23.2 Research Landscape
23.3 Research Benchmark and Hypothesis
23.4 Data Source
23.4.1 Primary Sources
23.4.2 Secondary Sources
23.5 Data Cross Validation
23.6 Disclaimer

Table 1:Global Electrolytic Copper Market Size and Growth Forecast Analysis by Product Segment (2020 VS 2025 VS 2032) & (Million USD)
Table 2:Global Electrolytic Copper Market Size and Growth Forecast Analysis by Product Application (2020 VS 2025 VS 2032) & (Million USD)
Table 3:Key Raw Materials and Market Concentration
Table 4:Electrolytic Copper Raw Material Suppliers and Contact Information
Table 5:Electrolytic Copper Downstream Customers List
Table 6:Electrolytic Copper Distributors/Dealers List
Table 7:Global Electrolytic Copper Capacity by Countries (2020-2025) & (K Ton)
Table 8:Global Electrolytic Copper Production by Countries (2020-2025) & (K Ton)
Table 9:Global Electrolytic Copper Market Sales Volume by Key Manufacturers (2021-2025) & (K Ton)
Table 10:Global Electrolytic Copper Market Revenue by Key Manufacturers (2021-2025) & (Million USD)
Table 11:Global Electrolytic Copper Market Position by Key Manufacturers
Table 12:China Electrolytic Copper Market Position by Key Manufacturers
Table 13:Global Key Manufacturers Headquarter and Key Area Served
Table 14:Global Electrolytic Copper Market Expansion and M&A Dynamic
Table 15:Jiangxi Copper Basic Information (Total Revenue, Employees, Main Business, Service Area and Contact Information)
Table 16:Jiangxi Copper Electrolytic Copper Product Features
Table 17:Jiangxi Copper Electrolytic Copper Product Revenue (Million USD), Sales Volume (K Ton), Price (USD/Ton) and Gross Margin (2021-2025)
Table 18:Tongling Nonferrous Metals Basic Information (Total Revenue, Employees, Main Business, Service Area and Contact Information)
Table 19:Tongling Nonferrous Metals Electrolytic Copper Product Features
Table 20:Tongling Nonferrous Metals Electrolytic Copper Product Revenue (Million USD), Sales Volume (K Ton), Price (USD/Ton) and Gross Margin (2021-2025)
Table 21:Yunnan Copper Basic Information (Total Revenue, Employees, Main Business, Service Area and Contact Information)
Table 22:Yunnan Copper Electrolytic Copper Product Features
Table 23:Yunnan Copper Electrolytic Copper Product Revenue (Million USD), Sales Volume (K Ton), Price (USD/Ton) and Gross Margin (2021-2025)
Table 24:Jinchuan Basic Information (Total Revenue, Employees, Main Business, Service Area and Contact Information)
Table 25:Jinchuan Electrolytic Copper Product Features
Table 26:Jinchuan Electrolytic Copper Product Revenue (Million USD), Sales Volume (K Ton), Price (USD/Ton) and Gross Margin (2021-2025)
Table 27:Daye Nonferrous Metals Basic Information (Total Revenue, Employees, Main Business, Service Area and Contact Information)
Table 28:Daye Nonferrous Metals Electrolytic Copper Product Features
Table 29:Daye Nonferrous Metals Electrolytic Copper Product Revenue (Million USD), Sales Volume (K Ton), Price (USD/Ton) and Gross Margin (2021-2025)
Table 30:Shandong Xiangguang Basic Information (Total Revenue, Employees, Main Business, Service Area and Contact Information)
Table 31:Shandong Xiangguang Electrolytic Copper Product Features
Table 32:Shandong Xiangguang Electrolytic Copper Product Revenue (Million USD), Sales Volume (K Ton), Price (USD/Ton) and Gross Margin (2021-2025)
Table 33:Henan Zhongyuan Gold Smelter Basic Information (Total Revenue, Employees, Main Business, Service Area and Contact Information)
Table 34:Henan Zhongyuan Gold Smelter Electrolytic Copper Product Features
Table 35:Henan Zhongyuan Gold Smelter Electrolytic Copper Product Revenue (Million USD), Sales Volume (K Ton), Price (USD/Ton) and Gross Margin (2021-2025)
Table 36:Shandong Fangyuan Basic Information (Total Revenue, Employees, Main Business, Service Area and Contact Information)
Table 37:Shandong Fangyuan Electrolytic Copper Product Features
Table 38:Shandong Fangyuan Electrolytic Copper Product Revenue (Million USD), Sales Volume (K Ton), Price (USD/Ton) and Gross Margin (2021-2025)
Table 39:ZTS Non-ferrous Metals Basic Information (Total Revenue, Employees, Main Business, Service Area and Contact Information)
Table 40:ZTS Non-ferrous Metals Electrolytic Copper Product Features
Table 41:ZTS Non-ferrous Metals Electrolytic Copper Product Revenue (Million USD), Sales Volume (K Ton), Price (USD/Ton) and Gross Margin (2021-2025)
Table 42:Baiyin Nonferrous Basic Information (Total Revenue, Employees, Main Business, Service Area and Contact Information)
Table 43:Baiyin Nonferrous Electrolytic Copper Product Features
Table 44:Baiyin Nonferrous Electrolytic Copper Product Revenue (Million USD), Sales Volume (K Ton), Price (USD/Ton) and Gross Margin (2021-2025)
Table 45:Global Electrolytic Copper Market Size and Growth Forecast by Countries (2020 VS 2025 VS 2032) & (Million USD)
Table 46:Global Electrolytic Copper Market Revenue by Countries (2020-2025) & (Million USD)
Table 47:Global Electrolytic Copper Market Share by Countries (2020-2025)
Table 48:Global Electrolytic Copper Market Revenue Forecast by Countries (2026-2032) & (Million USD)
Table 49:Global Electrolytic Copper Market Share Forecast by Countries (2026-2032)
Table 50:Global Electrolytic Copper Market Sales by Countries (2020-2025) & (K Ton)
Table 51:Global Electrolytic Copper Sales Volume Market Share by Countries (2020-2025)
Table 52:Global Electrolytic Copper Market Sales Volume Forecast by Countries (2026-2032) & (K Ton)
Table 53:Global Electrolytic Copper Sales Volume Market Share Forecast by Countries (2026-2032)
Table 54:Global Electrolytic Copper Market Revenue by Product Segment (2020-2025) & (Million USD)
Table 55:Global Electrolytic Copper Market Revenue Forecast by Product Segment (2026-2032) & (Million USD)
Table 56:Global Electrolytic Copper Market Sales Volume by Product Segment (2020-2025) & (K Ton)
Table 57:Global Electrolytic Copper Market Sales Volume Forecast by Product Segment (2026-2032) & (K Ton)
Table 58:Global Electrolytic Copper Market Revenue by Product Application (2020-2025) & (Million USD)
Table 59:Global Electrolytic Copper Market Revenue Forecast by Product Application (2026-2032) & (Million USD)
Table 60:Global Electrolytic Copper Market Sales Volume by Product Application (2020-2025) & (K Ton)
Table 61:Global Electrolytic Copper Market Sales Volume Forecast by Product Application (2026-2032) & (K Ton)
Table 62:United States Electrolytic Copper Market Revenue by Product Segment (2020-2025) & (Million USD)
Table 63:United States Electrolytic Copper Market Revenue Forecast by Product Segment (2026-2032) & (Million USD)
Table 64:United States Electrolytic Copper Market Sales Volume by Product Segment (2020-2025) & (K Ton)
Table 65:United States Electrolytic Copper Market Sales Volume Forecast by Segment (2026-2032) & (K Ton)
Table 66:United States Electrolytic Copper Market Revenue by Product Application (2020-2025) & (Million USD)
Table 67:United States Electrolytic Copper Market Revenue Forecast by Product Application (2026-2032) & (Million USD)
Table 68:United States Electrolytic Copper Market Sales Volume by Product Application (2020-2025) & (K Ton)
Table 69:United States Electrolytic Copper Market Sales Volume Forecast by Product Application (2026-2032) & (K Ton)
Table 70:China Electrolytic Copper Market Revenue by Product Segment (2020-2025) & (Million USD)
Table 71:China Electrolytic Copper Market Revenue Forecast by Product Segment (2026-2032) & (Million USD)
Table 72:China Electrolytic Copper Market Sales Volume by Product Segment (2020-2025) & (K Ton)
Table 73:China Electrolytic Copper Market Sales Volume Forecast by Segment (2026-2032) & (K Ton)
Table 74:China Electrolytic Copper Market Revenue by Product Application (2020-2025) & (Million USD)
Table 75:China Electrolytic Copper Market Revenue Forecast by Product Application (2026-2032) & (Million USD)
Table 76:China Electrolytic Copper Market Sales Volume by Product Application (2020-2025) & (K Ton)
Table 77:China Electrolytic Copper Market Sales Volume Forecast by Product Application (2026-2032) & (K Ton)
Table 78:Germany Electrolytic Copper Market Revenue by Product Segment (2020-2025) & (Million USD)
Table 79:Germany Electrolytic Copper Market Revenue Forecast by Product Segment (2026-2032) & (Million USD)
Table 80:Germany Electrolytic Copper Market Sales Volume by Product Segment (2020-2025) & (K Ton)
Table 81:Germany Electrolytic Copper Market Sales Volume Forecast by Segment (2026-2032) & (K Ton)
Table 82:Germany Electrolytic Copper Market Revenue by Product Application (2020-2025) & (Million USD)
Table 83:Germany Electrolytic Copper Market Revenue Forecast by Product Application (2026-2032) & (Million USD)
Table 84:Germany Electrolytic Copper Market Sales Volume by Product Application (2020-2025) & (K Ton)
Table 85:Germany Electrolytic Copper Market Sales Volume Forecast by Product Application (2026-2032) & (K Ton)
Table 86:Japan Electrolytic Copper Market Revenue by Product Segment (2020-2025) & (Million USD)
Table 87:Japan Electrolytic Copper Market Revenue Forecast by Product Segment (2026-2032) & (Million USD)
Table 88:Japan Electrolytic Copper Market Sales Volume by Product Segment (2020-2025) & (K Ton)
Table 89:Japan Electrolytic Copper Market Sales Volume Forecast by Segment (2026-2032) & (K Ton)
Table 90:Japan Electrolytic Copper Market Revenue by Product Application (2020-2025) & (Million USD)
Table 91:Japan Electrolytic Copper Market Revenue Forecast by Product Application (2026-2032) & (Million USD)
Table 92:Japan Electrolytic Copper Market Sales Volume by Product Application (2020-2025) & (K Ton)
Table 93:Japan Electrolytic Copper Market Sales Volume Forecast by Product Application (2026-2032) & (K Ton)
Table 94:France Electrolytic Copper Market Revenue by Product Segment (2020-2025) & (Million USD)
Table 95:France Electrolytic Copper Market Revenue Forecast by Product Segment (2026-2032) & (Million USD)
Table 96:France Electrolytic Copper Market Sales Volume by Product Segment (2020-2025) & (K Ton)
Table 97:France Electrolytic Copper Market Sales Volume Forecast by Segment (2026-2032) & (K Ton)
Table 98:France Electrolytic Copper Market Revenue by Product Application (2020-2025) & (Million USD)
Table 99:France Electrolytic Copper Market Revenue Forecast by Product Application (2026-2032) & (Million USD)
Table 100:France Electrolytic Copper Market Sales Volume by Product Application (2020-2025) & (K Ton)
Table 101:France Electrolytic Copper Market Sales Volume Forecast by Product Application (2026-2032) & (K Ton)
Table 102:South Korea Electrolytic Copper Market Revenue by Product Segment (2020-2025) & (Million USD)
Table 103:South Korea Electrolytic Copper Market Revenue Forecast by Product Segment (2026-2032) & (Million USD)
Table 104:South Korea Electrolytic Copper Market Sales Volume by Product Segment (2020-2025) & (K Ton)
Table 105:South Korea Electrolytic Copper Market Sales Volume Forecast by Segment (2026-2032) & (K Ton)
Table 106:South Korea Electrolytic Copper Market Revenue by Product Application (2020-2025) & (Million USD)
Table 107:South Korea Electrolytic Copper Market Revenue Forecast by Product Application (2026-2032) & (Million USD)
Table 108:South Korea Electrolytic Copper Market Sales Volume by Product Application (2020-2025) & (K Ton)
Table 109:South Korea Electrolytic Copper Market Sales Volume Forecast by Product Application (2026-2032) & (K Ton)
Table 110:United Kingdom Electrolytic Copper Market Revenue by Product Segment (2020-2025) & (Million USD)
Table 111:United Kingdom Electrolytic Copper Market Revenue Forecast by Product Segment (2026-2032) & (Million USD)
Table 112:United Kingdom Electrolytic Copper Market Sales Volume by Product Segment (2020-2025) & (K Ton)
Table 113:United Kingdom Electrolytic Copper Market Sales Volume Forecast by Segment (2026-2032) & (K Ton)
Table 114:United Kingdom Electrolytic Copper Market Revenue by Product Application (2020-2025) & (Million USD)
Table 115:United Kingdom Electrolytic Copper Market Revenue Forecast by Product Application (2026-2032) & (Million USD)
Table 116:United Kingdom Electrolytic Copper Market Sales Volume by Product Application (2020-2025) & (K Ton)
Table 117:United Kingdom Electrolytic Copper Market Sales Volume Forecast by Product Application (2026-2032) & (K Ton)
Table 118:India Electrolytic Copper Market Revenue by Product Segment (2020-2025) & (Million USD)
Table 119:India Electrolytic Copper Market Revenue Forecast by Product Segment (2026-2032) & (Million USD)
Table 120:India Electrolytic Copper Market Sales Volume by Product Segment (2020-2025) & (K Ton)
Table 121:India Electrolytic Copper Market Sales Volume Forecast by Segment (2026-2032) & (K Ton)
Table 122:India Electrolytic Copper Market Revenue by Product Application (2020-2025) & (Million USD)
Table 123:India Electrolytic Copper Market Revenue Forecast by Product Application (2026-2032) & (Million USD)
Table 124:India Electrolytic Copper Market Sales Volume by Product Application (2020-2025) & (K Ton)
Table 125:India Electrolytic Copper Market Sales Volume Forecast by Product Application (2026-2032) & (K Ton)
Table 126:Italy Electrolytic Copper Market Revenue by Product Segment (2020-2025) & (Million USD)
Table 127:Italy Electrolytic Copper Market Revenue Forecast by Product Segment (2026-2032) & (Million USD)
Table 128:Italy Electrolytic Copper Market Sales Volume by Product Segment (2020-2025) & (K Ton)
Table 129:Italy Electrolytic Copper Market Sales Volume Forecast by Segment (2026-2032) & (K Ton)
Table 130:Italy Electrolytic Copper Market Revenue by Product Application (2020-2025) & (Million USD)
Table 131:Italy Electrolytic Copper Market Revenue Forecast by Product Application (2026-2032) & (Million USD)
Table 132:Italy Electrolytic Copper Market Sales Volume by Product Application (2020-2025) & (K Ton)
Table 133:Italy Electrolytic Copper Market Sales Volume Forecast by Product Application (2026-2032) & (K Ton)
Table 134:Brazil Electrolytic Copper Market Revenue by Product Segment (2020-2025) & (Million USD)
Table 135:Brazil Electrolytic Copper Market Revenue Forecast by Product Segment (2026-2032) & (Million USD)
Table 136:Brazil Electrolytic Copper Market Sales Volume by Product Segment (2020-2025) & (K Ton)
Table 137:Brazil Electrolytic Copper Market Sales Volume Forecast by Segment (2026-2032) & (K Ton)
Table 138:Brazil Electrolytic Copper Market Revenue by Product Application (2020-2025) & (Million USD)
Table 139:Brazil Electrolytic Copper Market Revenue Forecast by Product Application (2026-2032) & (Million USD)
Table 140:Brazil Electrolytic Copper Market Sales Volume by Product Application (2020-2025) & (K Ton)
Table 141:Brazil Electrolytic Copper Market Sales Volume Forecast by Product Application (2026-2032) & (K Ton)
Table 142:Mexico Electrolytic Copper Market Revenue by Product Segment (2020-2025) & (Million USD)
Table 143:Mexico Electrolytic Copper Market Revenue Forecast by Product Segment (2026-2032) & (Million USD)
Table 144:Mexico Electrolytic Copper Market Sales Volume by Product Segment (2020-2025) & (K Ton)
Table 145:Mexico Electrolytic Copper Market Sales Volume Forecast by Segment (2026-2032) & (K Ton)
Table 146:Mexico Electrolytic Copper Market Revenue by Product Application (2020-2025) & (Million USD)
Table 147:Mexico Electrolytic Copper Market Revenue Forecast by Product Application (2026-2032) & (Million USD)
Table 148:Mexico Electrolytic Copper Market Sales Volume by Product Application (2020-2025) & (K Ton)
Table 149:Mexico Electrolytic Copper Market Sales Volume Forecast by Product Application (2026-2032) & (K Ton)
Table 150:Indonesia Electrolytic Copper Market Revenue by Product Segment (2020-2025) & (Million USD)
Table 151:Indonesia Electrolytic Copper Market Revenue Forecast by Product Segment (2026-2032) & (Million USD)
Table 152:Indonesia Electrolytic Copper Market Sales Volume by Product Segment (2020-2025) & (K Ton)
Table 153:Indonesia Electrolytic Copper Market Sales Volume Forecast by Segment (2026-2032) & (K Ton)
Table 154:Indonesia Electrolytic Copper Market Revenue by Product Application (2020-2025) & (Million USD)
Table 155:Indonesia Electrolytic Copper Market Revenue Forecast by Product Application (2026-2032) & (Million USD)
Table 156:Indonesia Electrolytic Copper Market Sales Volume by Product Application (2020-2025) & (K Ton)
Table 157:Indonesia Electrolytic Copper Market Sales Volume Forecast by Product Application (2026-2032) & (K Ton)
Table 158:Vietnam Electrolytic Copper Market Revenue by Product Segment (2020-2025) & (Million USD)
Table 159:Vietnam Electrolytic Copper Market Revenue Forecast by Product Segment (2026-2032) & (Million USD)
Table 160:Vietnam Electrolytic Copper Market Sales Volume by Product Segment (2020-2025) & (K Ton)
Table 161:Vietnam Electrolytic Copper Market Sales Volume Forecast by Segment (2026-2032) & (K Ton)
Table 162:Vietnam Electrolytic Copper Market Revenue by Product Application (2020-2025) & (Million USD)
Table 163:Vietnam Electrolytic Copper Market Revenue Forecast by Product Application (2026-2032) & (Million USD)
Table 164:Vietnam Electrolytic Copper Market Sales Volume by Product Application (2020-2025) & (K Ton)
Table 165:Vietnam Electrolytic Copper Market Sales Volume Forecast by Product Application (2026-2032) & (K Ton)
Table 166:South Africa Electrolytic Copper Market Revenue by Product Segment (2020-2025) & (Million USD)
Table 167:South Africa Electrolytic Copper Market Revenue Forecast by Product Segment (2026-2032) & (Million USD)
Table 168:South Africa Electrolytic Copper Market Sales Volume by Product Segment (2020-2025) & (K Ton)
Table 169:South Africa Electrolytic Copper Market Sales Volume Forecast by Segment (2026-2032) & (K Ton)
Table 170:South Africa Electrolytic Copper Market Revenue by Product Application (2020-2025) & (Million USD)
Table 171:South Africa Electrolytic Copper Market Revenue Forecast by Product Application (2026-2032) & (Million USD)
Table 172:South Africa Electrolytic Copper Market Sales Volume by Product Application (2020-2025) & (K Ton)
Table 173:South Africa Electrolytic Copper Market Sales Volume Forecast by Product Application (2026-2032) & (K Ton)
Table 174:Secondary Sources

Figure 1:Electrolytic Copper Product Scope
Figure 2:Global Electrolytic Copper Market Size and Growth Forecast Analysis (2020-2032) & (Million USD)
Figure 3:Global Electrolytic Copper Sales Volume and Growth Forecast Analysis (2020-2032) & (K Ton)
Figure 4:Global Electrolytic Copper Product Segment Market Share (2025 & 2032)
Figure 5:Global Electrolytic Copper Product Application Market Share (2025 & 2032)
Figure 6:1# Standard Copper Product Scope
Figure 7:2# Standard Copper Product Scope
Figure 8:Grade A Copper Product Scope
Figure 9:Electric-Power Industry Product Scope
Figure 10:Appliance Industry Product Scope
Figure 11:Automotive and Transportation Product Scope
Figure 12:Electronic Product Scope
Figure 13:Construction Product Scope
Figure 14:Electrolytic Copper Industrial Chain Framework
Figure 15:Global Electrolytic Copper Capacity, Production and Utilization (2020-2032) & (K Ton)
Figure 16:Global Electrolytic Copper Market by Geographic Segmentation in 2025
Figure 17:Global Electrolytic Copper Market Share by Countries (2020 VS 2025)
Figure 18:Global Electrolytic Copper Sales Volume Market Share by Countries (2020 VS 2025)
Figure 19:United States Electrolytic Copper Market Size and Growth Forecast (2024 VS 2025 VS 2032) & (Million USD)
Figure 20:United States Electrolytic Copper Market Sales Volume and Growth Forecast (2020-2032) & (K Ton)
Figure 21:China Electrolytic Copper Market Size and Growth Forecast (2024 VS 2025 VS 2032) & (Million USD)
Figure 22:China Electrolytic Copper Market Sales Volume and Growth Forecast (2020-2032) & (K Ton)
Figure 23:Germany Electrolytic Copper Market Size and Growth Forecast (2024 VS 2025 VS 2032) & (Million USD)
Figure 24:Germany Electrolytic Copper Market Sales Volume and Growth Forecast (2020-2032) & (K Ton)
Figure 25:Japan Electrolytic Copper Market Size and Growth Forecast (2024 VS 2025 VS 2032) & (Million USD)
Figure 26:Japan Electrolytic Copper Market Sales Volume and Growth Forecast (2020-2032) & (K Ton)
Figure 27:France Electrolytic Copper Market Size and Growth Forecast (2024 VS 2025 VS 2032) & (Million USD)
Figure 28:France Electrolytic Copper Market Sales Volume and Growth Forecast (2020-2032) & (K Ton)
Figure 29:South Korea Electrolytic Copper Market Size and Growth Forecast (2024 VS 2025 VS 2032) & (Million USD)
Figure 30:South Korea Electrolytic Copper Market Sales Volume and Growth Forecast (2020-2032) & (K Ton)
Figure 31:United Kingdom Electrolytic Copper Market Size and Growth Forecast (2024 VS 2025 VS 2032) & (Million USD)
Figure 32:United Kingdom Electrolytic Copper Market Sales Volume and Growth Forecast (2020-2032) & (K Ton)
Figure 33:India Electrolytic Copper Market Size and Growth Forecast (2024 VS 2025 VS 2032) & (Million USD)
Figure 34:India Electrolytic Copper Market Sales Volume and Growth Forecast (2020-2032) & (K Ton)
Figure 35:Italy Electrolytic Copper Market Size and Growth Forecast (2024 VS 2025 VS 2032) & (Million USD)
Figure 36:Italy Electrolytic Copper Market Sales Volume and Growth Forecast (2020-2032) & (K Ton)
Figure 37:Brazil Electrolytic Copper Market Size and Growth Forecast (2024 VS 2025 VS 2032) & (Million USD)
Figure 38:Brazil Electrolytic Copper Market Sales Volume and Growth Forecast (2020-2032) & (K Ton)
Figure 39:Mexico Electrolytic Copper Market Size and Growth Forecast (2024 VS 2025 VS 2032) & (Million USD)
Figure 40:Mexico Electrolytic Copper Market Sales Volume and Growth Forecast (2020-2032) & (K Ton)
Figure 41:Indonesia Electrolytic Copper Market Size and Growth Forecast (2024 VS 2025 VS 2032) & (Million USD)
Figure 42:Indonesia Electrolytic Copper Market Sales Volume and Growth Forecast (2020-2032) & (K Ton)
Figure 43:Vietnam Electrolytic Copper Market Size and Growth Forecast (2024 VS 2025 VS 2032) & (Million USD)
Figure 44:Vietnam Electrolytic Copper Market Sales Volume and Growth Forecast (2020-2032) & (K Ton)
Figure 45:South Africa Electrolytic Copper Market Size and Growth Forecast (2024 VS 2025 VS 2032) & (Million USD)
Figure 46:South Africa Electrolytic Copper Market Sales Volume and Growth Forecast (2020-2032) & (K Ton)
Figure 47:Research Methodology
Figure 48:Primary Sources
Figure 49:Data Cross Validation
Global Electrolytic Copper Revenue and Market Share by Key Players
| Revenue (US$ Million) | 2020 | 2021 | 2022 | 2023 | 2024 |
| Jiangxi Copper | XX | XX | XX | XX | XX |
| Tongling Nonferrous Metals | XX | XX | XX | XX | XX |
| Yunnan Copper | XX | XX | XX | XX | XX |
| Jinchuan | XX | XX | XX | XX | XX |
| Daye Nonferrous Metals | XX | XX | XX | XX | XX |
| Shandong Xiangguang | XX | XX | XX | XX | XX |
| Henan Zhongyuan Gold Smelter | XX | XX | XX | XX | XX |
| Shandong Fangyuan | XX | XX | XX | XX | XX |
| ZTS Non-ferrous Metals | XX | XX | XX | XX | XX |
| Baiyin Nonferrous | XX | XX | XX | XX | XX |
| Other Companies | XX | XX | XX | XX | XX |
| Total | XX | XX | XX | XX | XX |
Global Electrolytic Copper Sales Volume and Market Share by Key Players
| Sales (K Ton) | 2020 | 2021 | 2022 | 2023 | 2024 |
| Jiangxi Copper | XX | XX | XX | XX | XX |
| Tongling Nonferrous Metals | XX | XX | XX | XX | XX |
| Yunnan Copper | XX | XX | XX | XX | XX |
| Jinchuan | XX | XX | XX | XX | XX |
| Daye Nonferrous Metals | XX | XX | XX | XX | XX |
| Shandong Xiangguang | XX | XX | XX | XX | XX |
| Henan Zhongyuan Gold Smelter | XX | XX | XX | XX | XX |
| Shandong Fangyuan | XX | XX | XX | XX | XX |
| ZTS Non-ferrous Metals | XX | XX | XX | XX | XX |
| Baiyin Nonferrous | XX | XX | XX | XX | XX |
| Other Companies | XX | XX | XX | XX | XX |
| Total | XX | XX | XX | XX | XX |


 English


 Related Reports


